Fig. 9
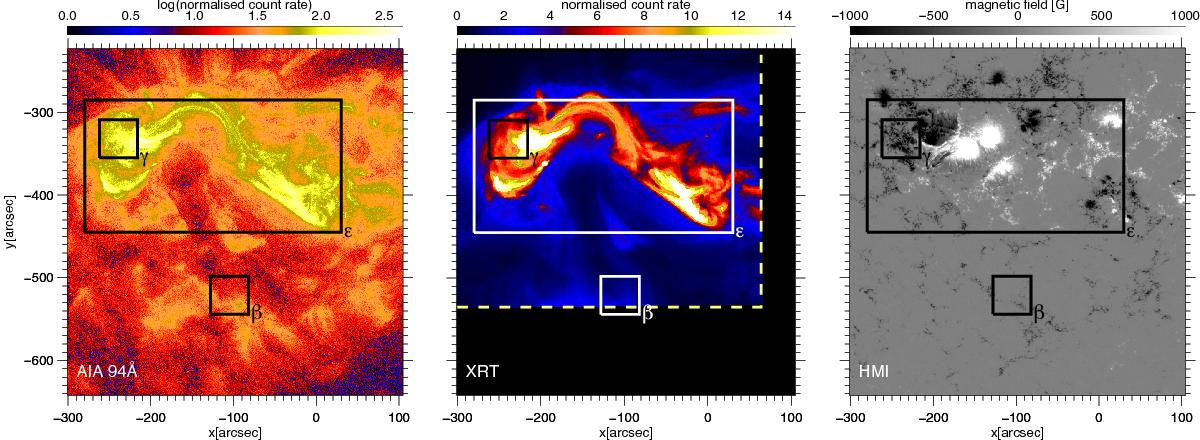
Emission from hot plasma and underlying magnetic field. The left two panels show the emission in the AIA channel at 94 Å and the Ti-poly channel of XRT on Hinode. The XRT image is taken during the Hi-C flight (at 18:54:48 UT). The right panel shows the HMI magnetogram. All panels cover the full field-of-view of the Hi-C data (cf. large rectangle in Fig. 2α). The inbox β indicates the region with the plage area hosting the small loop-like features as also displayed in Fig. 2β. The rectangle ε outlines the area covering hot coronal loops and moss as investigated by Testa et al. (2013). In their paper they display this region ε rotated counter-clockwise by 90° The moss area displayed in Fig. 2γ and marked here also by γ roughly corresponds to the moss region M3 of Testa et al. (2013), their Fig. 2. The yellow dashed line in the XRT image marks the edge of the XRT field-of-view. See Sect. 5.2.
Current usage metrics show cumulative count of Article Views (full-text article views including HTML views, PDF and ePub downloads, according to the available data) and Abstracts Views on Vision4Press platform.
Data correspond to usage on the plateform after 2015. The current usage metrics is available 48-96 hours after online publication and is updated daily on week days.
Initial download of the metrics may take a while.