Fig. 7
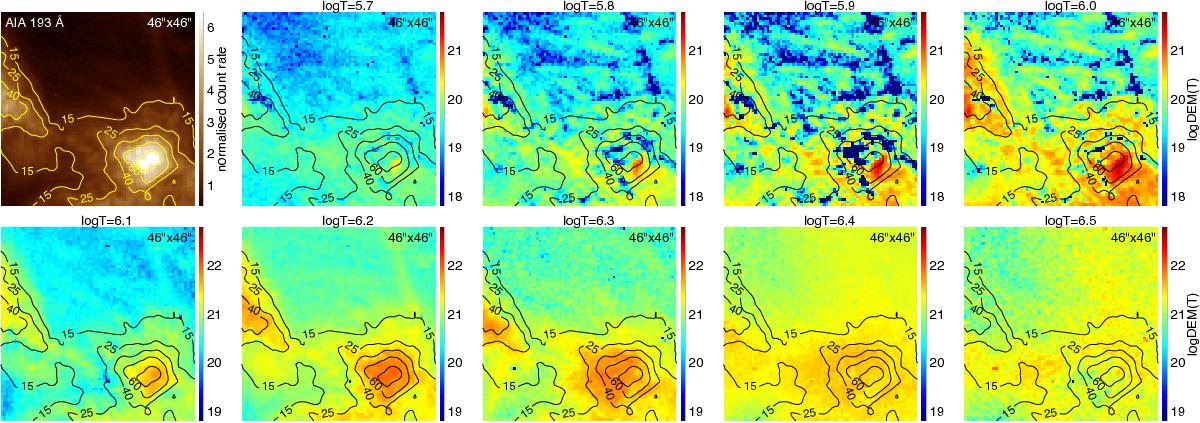
Coronal image and thermal structure. The top left panel shows the AIA image at 193 Å. The other panels display spatial maps of the differential emission measure (DEM) at different temperatures T labeled by log T [K]. All panels show the same field-of view that is identical to Fig. 2β. The plage region with the miniature loop-like structures is in the bottom-right part. For a better comparison between the panels we add contour lines of the brightness in the AIA 193 Å channel to all the panels. The numbers with the levels denote the percentage of the peak 193 Å brightness in this field-of-view. All DEM maps have the same dynamic range of 104 although their lower (and upper) limits change to best represent the DEM structures. See Sect. 5.1.
Current usage metrics show cumulative count of Article Views (full-text article views including HTML views, PDF and ePub downloads, according to the available data) and Abstracts Views on Vision4Press platform.
Data correspond to usage on the plateform after 2015. The current usage metrics is available 48-96 hours after online publication and is updated daily on week days.
Initial download of the metrics may take a while.