Fig. 5
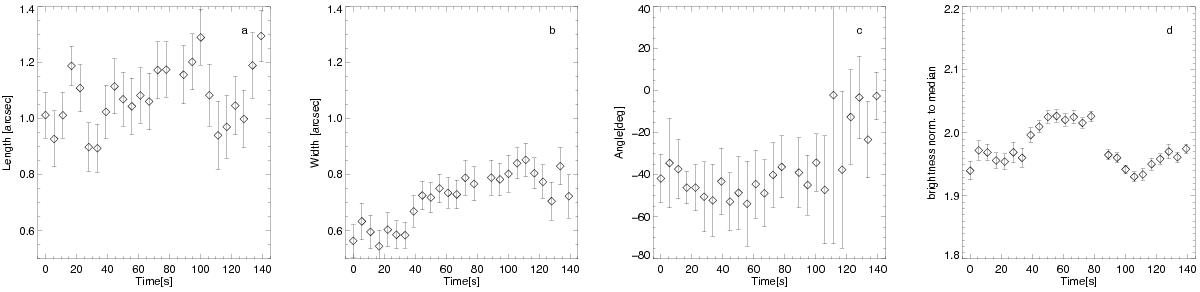
Temporal variation of the properties of one loop-like feature. This plot is for feature B as marked in Fig. 3. The properties of the other three features are shown in Figs. A.1 to A.3. These data are based on the ellipse fits of the features: a) the major axis representing the length; b) the minor axis the width; c) the angle of the major semi-axis with the E-W direction for the angle; and d) the intensity integrated over the ellipse for the structure brightness. The time is with respect to the first full-frame Hi-C image at 18:53:11 UT. See Sect. 3.1.
Current usage metrics show cumulative count of Article Views (full-text article views including HTML views, PDF and ePub downloads, according to the available data) and Abstracts Views on Vision4Press platform.
Data correspond to usage on the plateform after 2015. The current usage metrics is available 48-96 hours after online publication and is updated daily on week days.
Initial download of the metrics may take a while.