Fig. 4
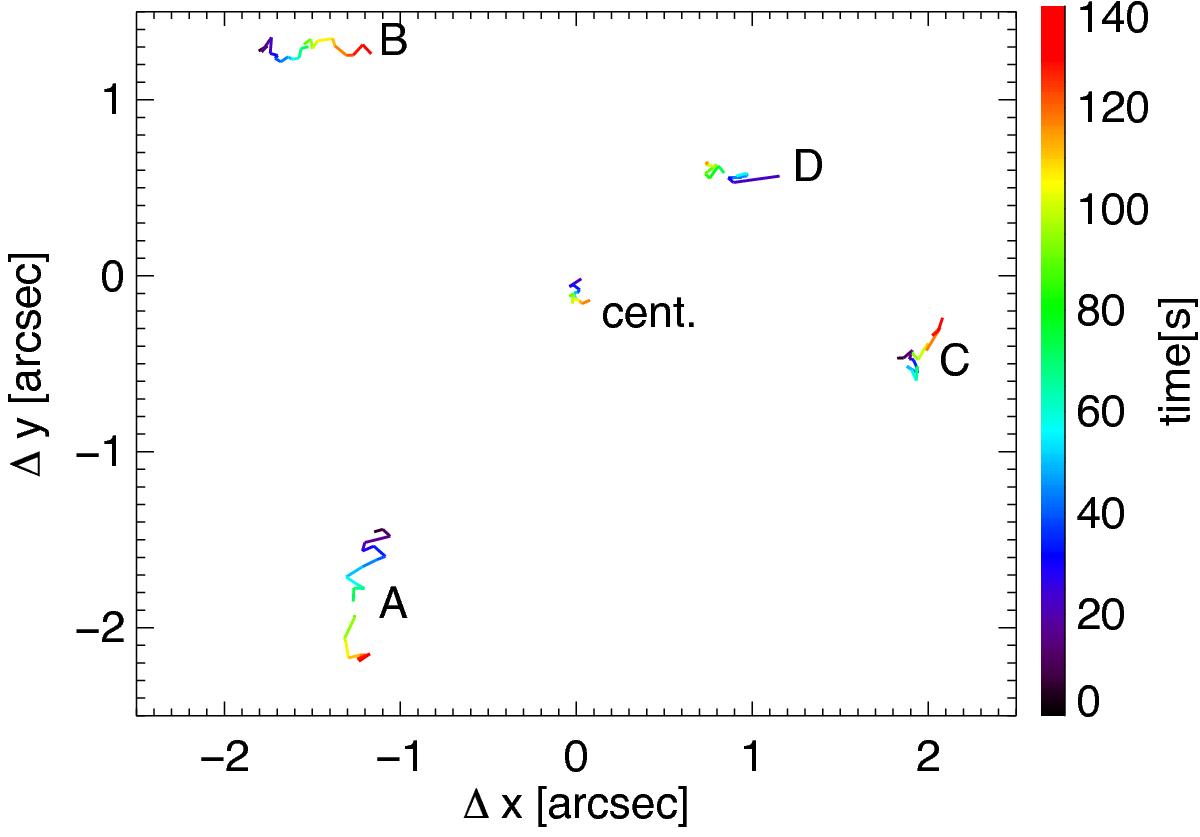
Horizontal motion of small loop-like features. The trajectories A to D show the centre of the respective features identified in Fig. 3 as a function of time (colour-coded) over 140 s (after 18:54:11 UT). The error estimate for the position from the ellipse fitting procedure is approximately 0.5 pixels or 0.05′′ (half a tick mark). For comparison, the trajectory labelled “cent.” shows the mean position of the four loop-like features A to D. See Sect. 3.1.
Current usage metrics show cumulative count of Article Views (full-text article views including HTML views, PDF and ePub downloads, according to the available data) and Abstracts Views on Vision4Press platform.
Data correspond to usage on the plateform after 2015. The current usage metrics is available 48-96 hours after online publication and is updated daily on week days.
Initial download of the metrics may take a while.