Fig. 2
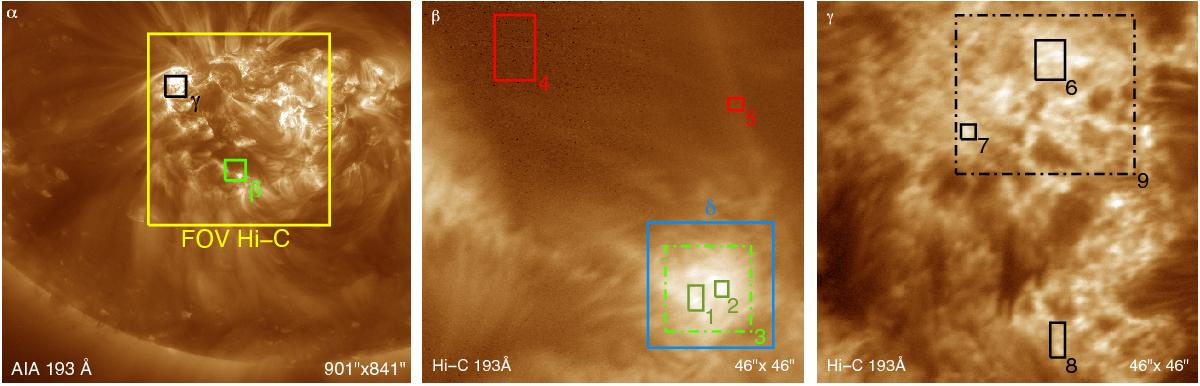
Active region context and regions of interest. All images are taken in the 193 Å channel showing emission around 1.5 MK (see Table 1). Panel α): part of the solar disk seen in AIA during the Hi-C rocket flight. The full field-of-view of Hi-C is indicated by the yellow box. The green and black boxes β and γ indicate the plage area and the moss region displayed in panels β and γ, respectively. Panel β): zoom into the plage region south of the active region (46′′ × 46′′). The boxes 1 to 5 indicates features used for the thermal study in Sect. 5.1. The box δ highlights the field-of view shown in Fig. 3. Panel γ): zoom into a moss region. As in panel β), the numbered boxes show the features for the thermal study.
Current usage metrics show cumulative count of Article Views (full-text article views including HTML views, PDF and ePub downloads, according to the available data) and Abstracts Views on Vision4Press platform.
Data correspond to usage on the plateform after 2015. The current usage metrics is available 48-96 hours after online publication and is updated daily on week days.
Initial download of the metrics may take a while.