Fig. B.1
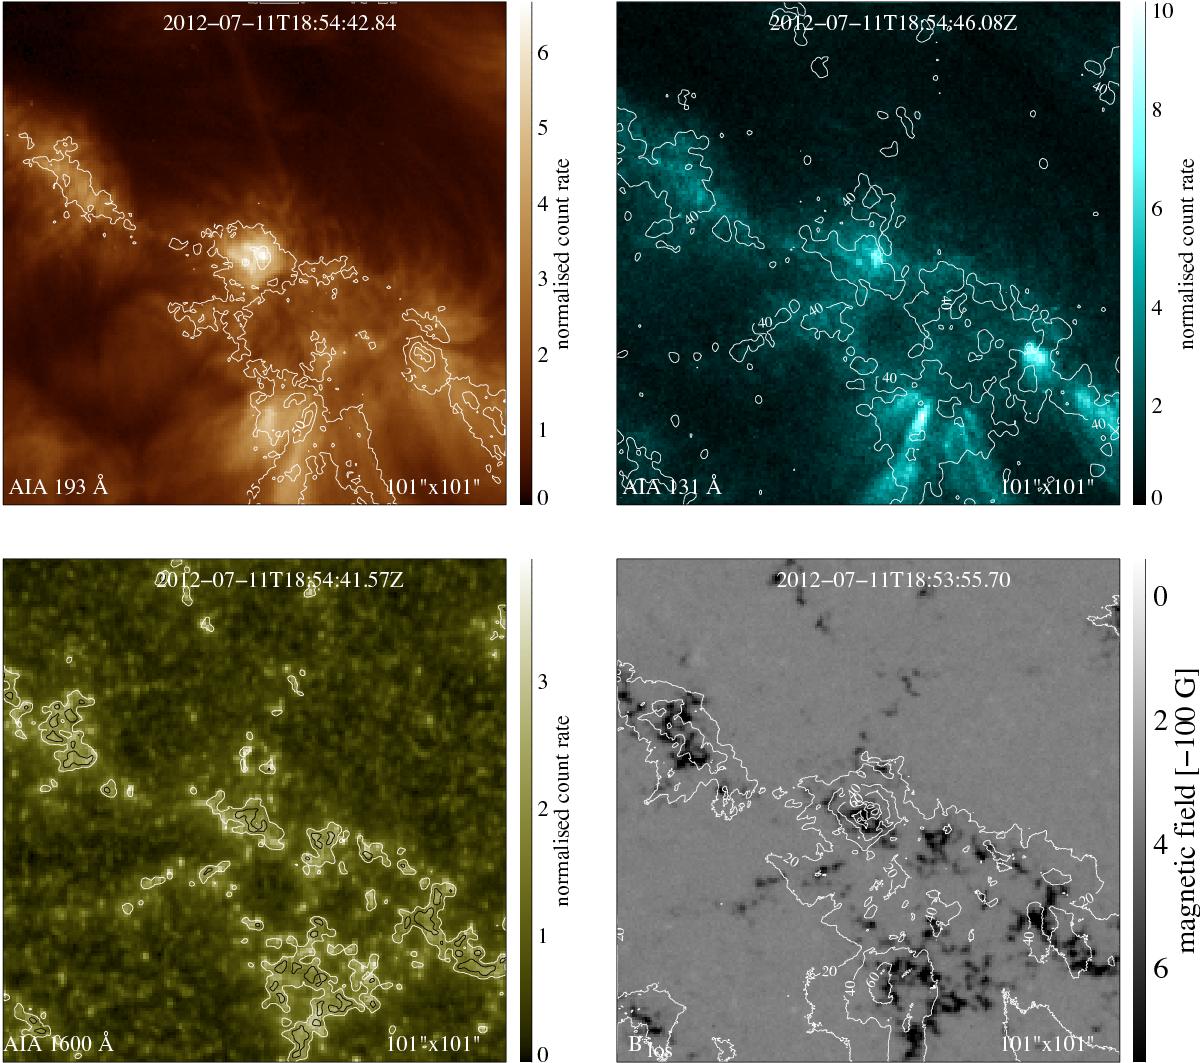
Illustration of the alignment procedure. The panels show the sequence of 101″ × 101″ images of the alignment chain, that is, AIA 193 Å → AIA 131 Å → AIA 1600 Å → HMI magnetogram. In each image the contours of the respective image following in the chain are overplotted. The Hi-C 193 Å image is aligned with the AIA 193 Å channel and its contours are overplotted on the HMI magnetogram. The magnetogram contours are at −100 G (white) and −300 G (black). The other contours show the percentages of the maximum brightness in the respective channel (numbers with the contour lines).
Current usage metrics show cumulative count of Article Views (full-text article views including HTML views, PDF and ePub downloads, according to the available data) and Abstracts Views on Vision4Press platform.
Data correspond to usage on the plateform after 2015. The current usage metrics is available 48-96 hours after online publication and is updated daily on week days.
Initial download of the metrics may take a while.