Fig. 3
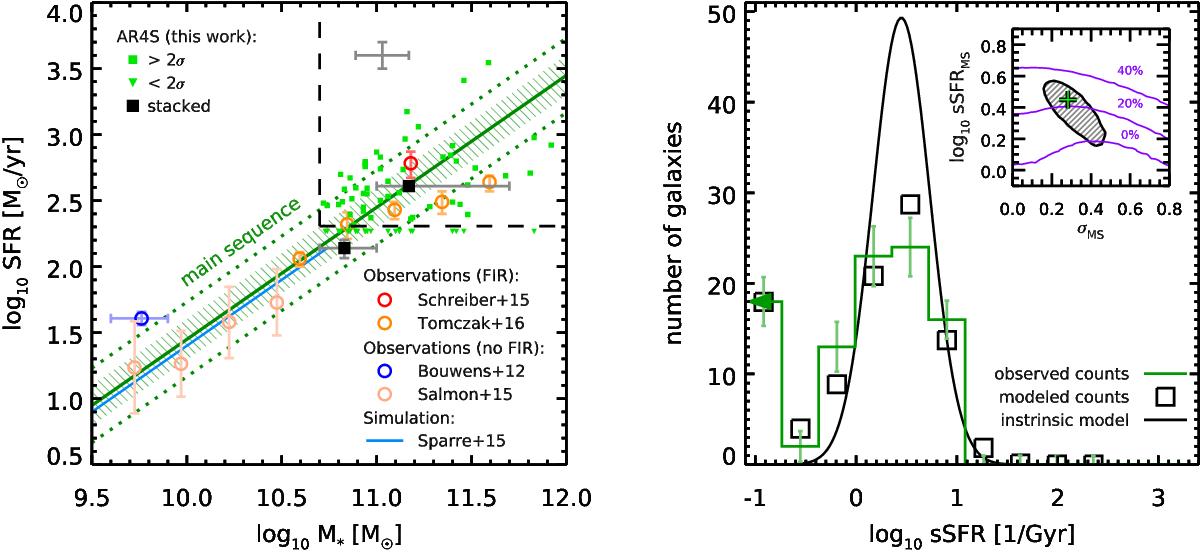
Left: relation between the star-formation rate (SFR) and stellar mass (M∗) at z = 4. Our ALMA sample is shown with small green squares (>2σ), and downward-facing triangles (<2σ). The gray cross at the top of the plot indicates the systematic uncertainty affecting our measurements (see text). The median SFR of our sample in two mass bins is shown with black squares (correcting the median for the contaminant population, see text). The green lines are our estimate of the z = 4 MS locus (solid line) and scatter (dotted lines) as determined from modeling the sSFR distribution (see text and figure on the right), and the hatched area in the background indicates the uncertainty on the MS locus. Observations from the literature are shown with open circles, from Bouwens et al. (2012) (blue) and Salmon et al. (2015) (pink) who both derived their SFRs without mid-IR or far-IR observations, while Tomczak et al. (2016) (orange, z = 3.5) and Schreiber et al. (2015) (red) both used Herschel stacking. The latter are corrected by −0.1 dex to account for the difference between the mean and median. Finally, the MS relation found in the Illustris simulation is shown as a blue line (Sparre et al. 2015). Right: distribution of sSFR = SFR /M∗ for our sample. The observed counts (including non-detections) are shown with a green histogram and error bars. The best-fit modeled intrinsic distribution is shown in black in the background, and the modeled counts (simulating measurement uncertainties and selection effects) are shown with open squares. The 1σ confidence region for the model parameters is shown in inset, where the green cross gives the position of minimum χ2, and the purple lines indicate the contaminant fraction required by the fit (see text).
Current usage metrics show cumulative count of Article Views (full-text article views including HTML views, PDF and ePub downloads, according to the available data) and Abstracts Views on Vision4Press platform.
Data correspond to usage on the plateform after 2015. The current usage metrics is available 48-96 hours after online publication and is updated daily on week days.
Initial download of the metrics may take a while.