Fig. 2
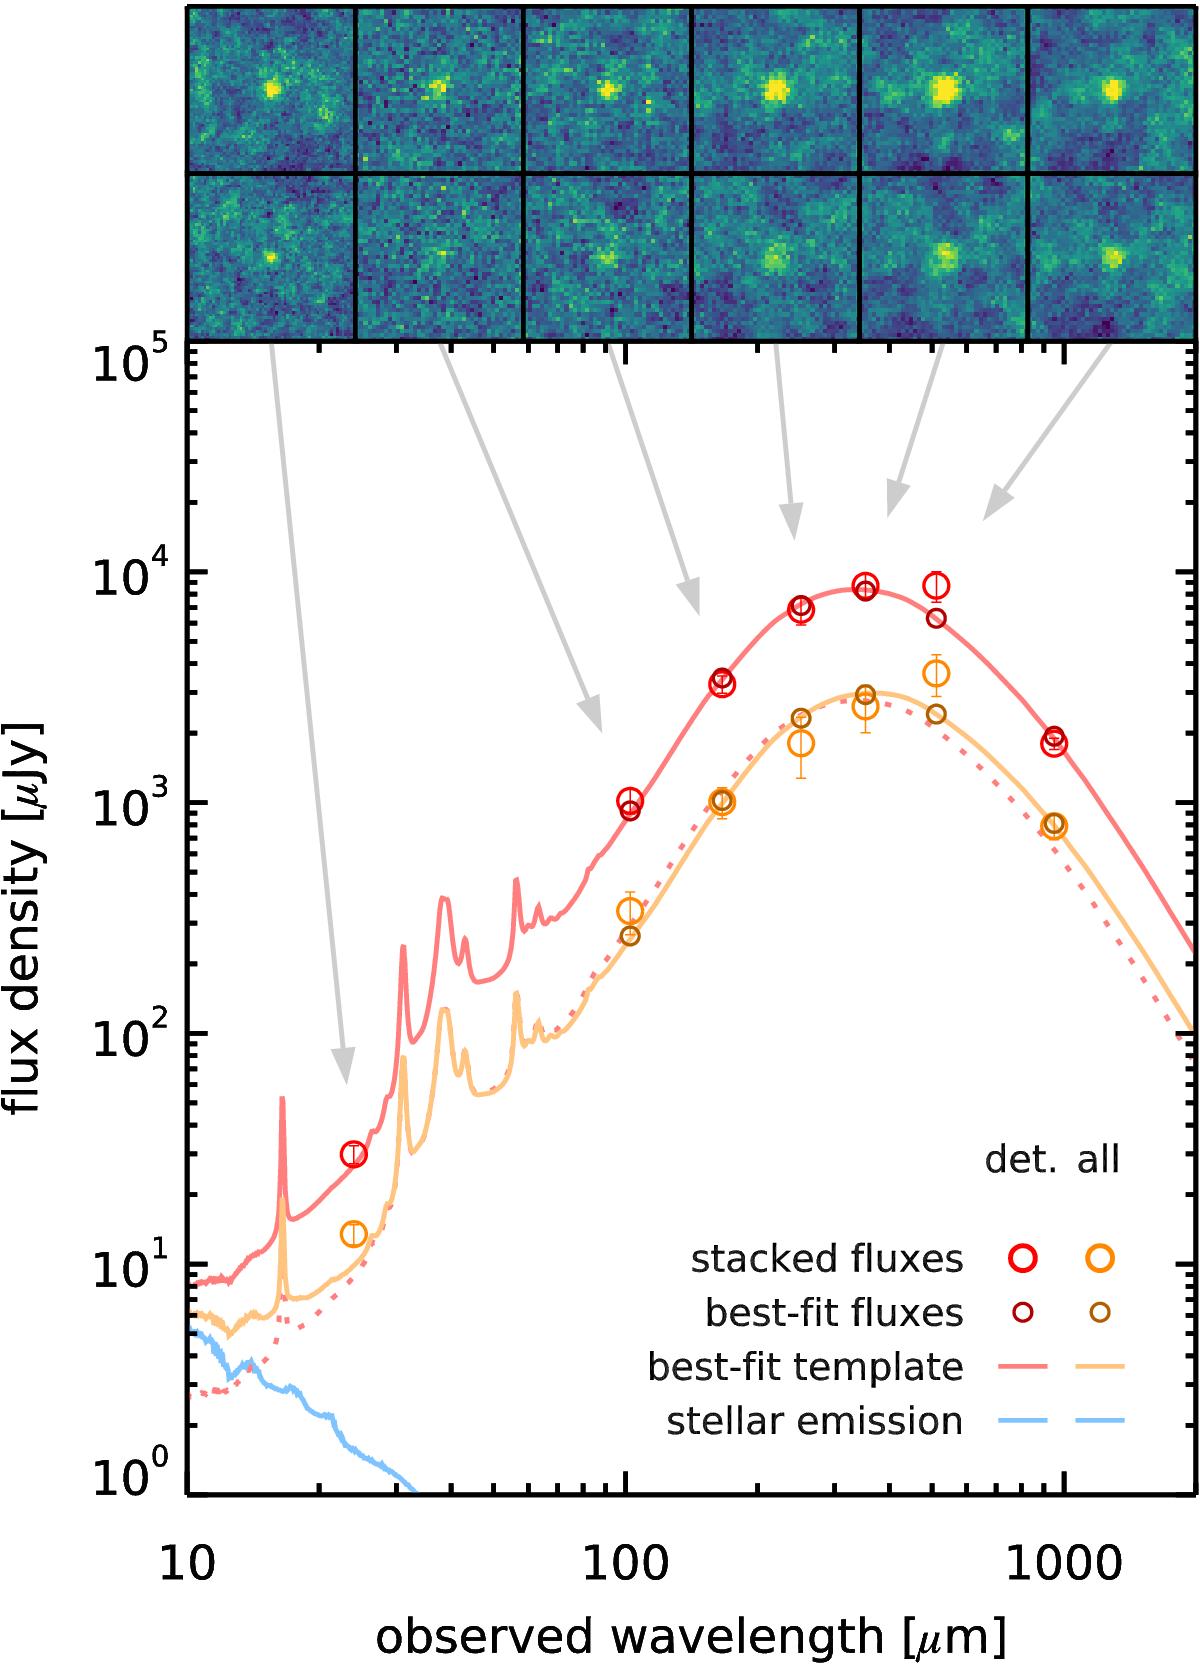
Stacked mid- to far-IR SED of our full sample (orange) and only the 3σ ALMA detections (red). The large open circles with error bars are the stacked fluxes, with SPIRE fluxes corrected for flux boosting from clustering (see text). Darker and smaller circles show the best-fit model fluxes, and the corresponding template is shown with a solid line in the background (NB: MIPS 24 μm was not used in the fit). The blue solid line is the stellar emission, estimated by fitting the stacked UV-to-near-IR photometry with FAST (Kriek et al. 2009). The dotted line is the best-fit SED of the ALMA detections, rescaled to the LIR of the whole sample for easier comparison. The stacked cutouts are shown at the top of the plot, both for the ALMA detections (top) and the full sample (bottom). The arrows help identify which flux measurement they correspond to.
Current usage metrics show cumulative count of Article Views (full-text article views including HTML views, PDF and ePub downloads, according to the available data) and Abstracts Views on Vision4Press platform.
Data correspond to usage on the plateform after 2015. The current usage metrics is available 48-96 hours after online publication and is updated daily on week days.
Initial download of the metrics may take a while.