Fig. 1
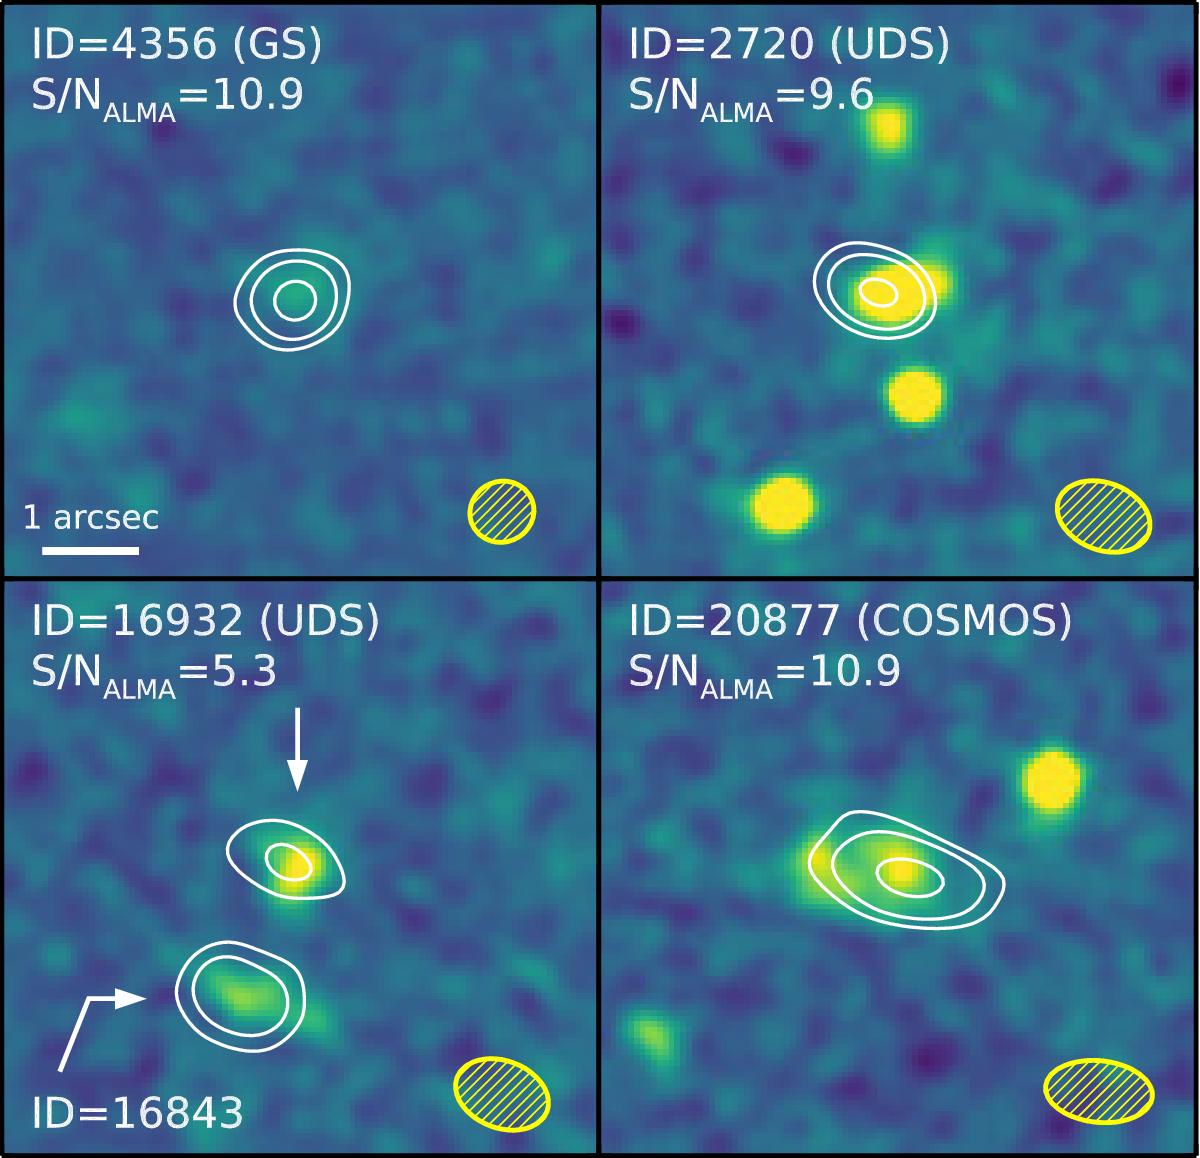
Examples of ALMA-detected galaxies in our sample. The HST F160W image is shown in the background, smoothed by a 0.3″ FWHM Gaussian to reveal extended features. The white contours show the extent of the ALMA emission (3, 5, 10 and 17σ) after applying tapering. The size and orientation of the ALMA clean beam is given with a yellow hatched region (FWHM). The CANDELS ID of each target is given at the top of each cutout, together with the S/N of the integrated ALMA flux.
Current usage metrics show cumulative count of Article Views (full-text article views including HTML views, PDF and ePub downloads, according to the available data) and Abstracts Views on Vision4Press platform.
Data correspond to usage on the plateform after 2015. The current usage metrics is available 48-96 hours after online publication and is updated daily on week days.
Initial download of the metrics may take a while.