Fig. A.1
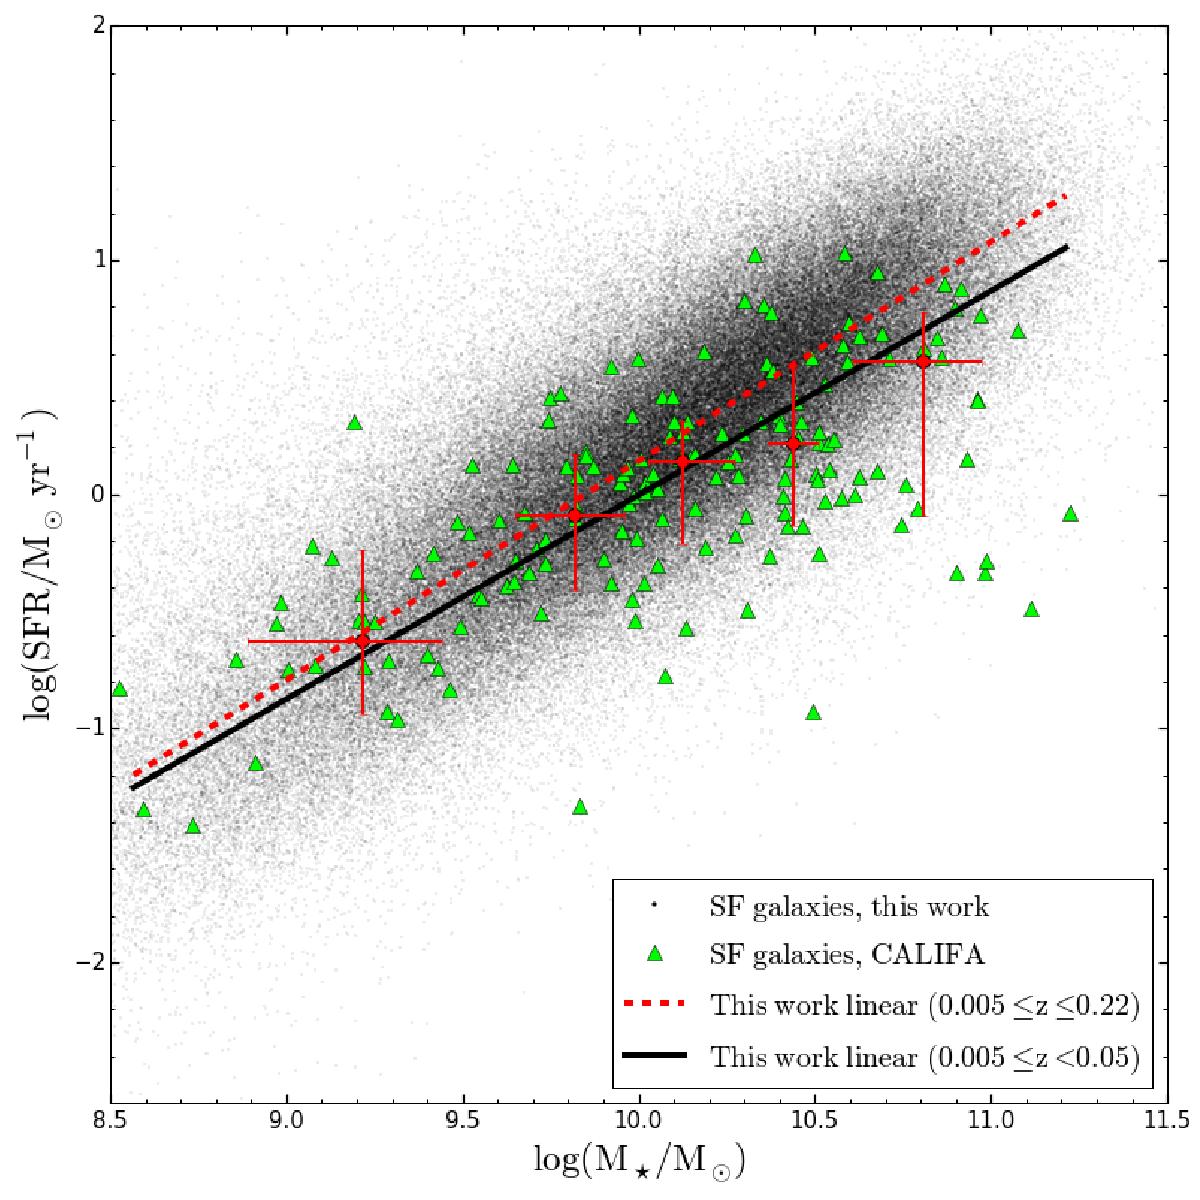
SFR-M⋆ relation for SDSS (this work) and CALIFA (Catalán-Torrecilla et al. 2015) star-forming galaxies. SFR-M⋆ fit to the running median for bins of 2000 objects obtained in this work for the complete sample (red dashed line) and for bins of 1000 objects in the range of z between 0.005 ≤ z< 0.05 (black solid line). Red dots represent the median values of SFR and M⋆ for CALIFA star-forming galaxies along five stellar mass bins for an equitable number of galaxies in each bin. The error bars in x- and y-axis represent the ±1σ confidence interval for stellar mass and SFR, respectively.
Current usage metrics show cumulative count of Article Views (full-text article views including HTML views, PDF and ePub downloads, according to the available data) and Abstracts Views on Vision4Press platform.
Data correspond to usage on the plateform after 2015. The current usage metrics is available 48-96 hours after online publication and is updated daily on week days.
Initial download of the metrics may take a while.