Fig. 7
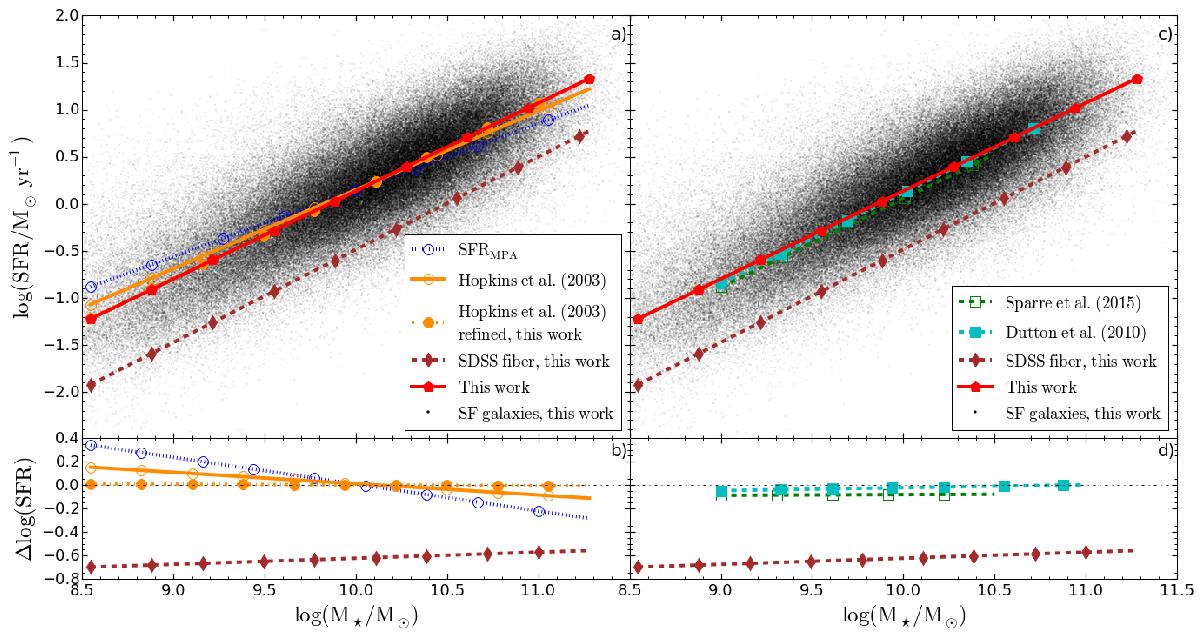
SFRThis work−M⋆ relation for star-forming galaxies compared with previous theoretical and observational works. Comparison with observational studies: Panel a) SFR-M⋆ fits to the running median for bins of 2000 objects obtained in this work (red solid line) and from the SDSS fibre (brown dashed line), together with the values provided by MPA-JHU (blue dotted line), using the Hopkins et al. (2003) recipe (orange solid line), and from our refined method of Hopkins et al. (2003) recipe (orange dashed line). Panel b) Difference vs. M⋆ between SDSS fiber SFRs and SFRThis work and between observational studies and SFRThis work (colours as in upper left panel). Dotted line shows Δlog (SFR) = 0. Comparison with theoretical studies: Panel c) SFR-M⋆ fits to the running median for bins of 2000 objects obtained in this work (red solid line) and from the SDSS fibre (brown dashed line), together with the predictions from Sparre et al. (2015) (green dashed line) and Dutton et al. (2010; cyan dashed line). Panel d) Difference vs. M⋆ between SDSS fiber SFRs and SFRThis work and between theoretical predictions and SFRThis work (colours as in upper right panel). Dotted line shows Δlog (SFR) = 0.
Current usage metrics show cumulative count of Article Views (full-text article views including HTML views, PDF and ePub downloads, according to the available data) and Abstracts Views on Vision4Press platform.
Data correspond to usage on the plateform after 2015. The current usage metrics is available 48-96 hours after online publication and is updated daily on week days.
Initial download of the metrics may take a while.