Fig. 6
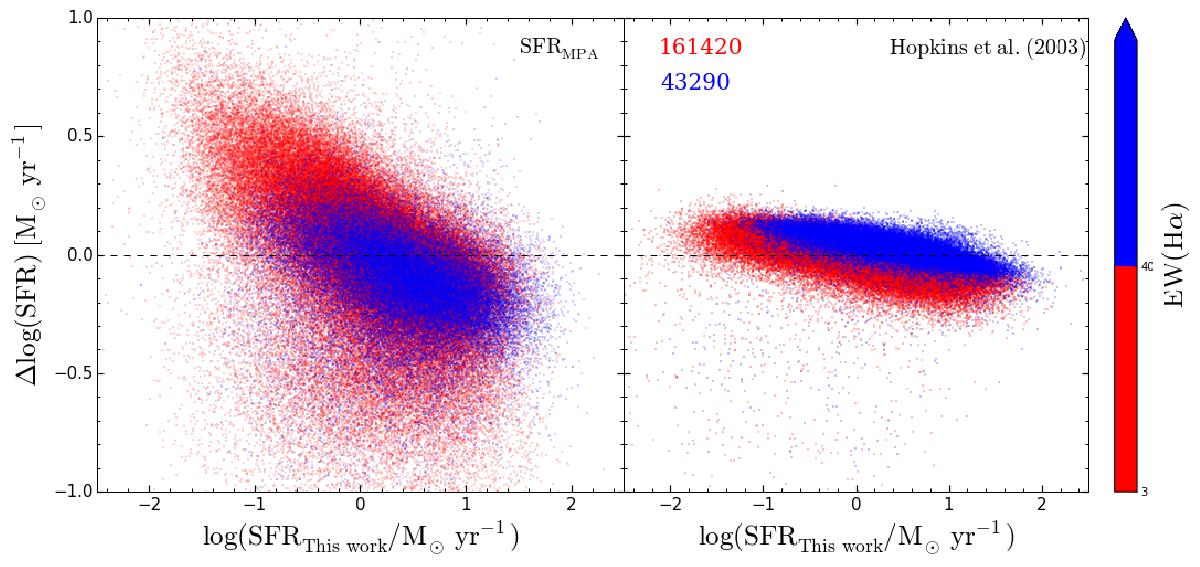
Left panel: difference, Δlog (SFR), of total SFR provided by MPA-JHU (Brinchmann et al. 2004b; Salim et al. 2007) and our total empirical SFRThis work as a function of SFRThis work; right panel: difference of the total SFR derived using the Hopkins et al. (2003) aperture correction for the Hα flux and SFRThis work as a function SFRThis work. Upper numbers represent the number of high- (red points) and low-level (blue points) Hα emitting galaxies (colour–coded according to the EW(Hα) colour bar). The black dashed line indicates Δlog (SFR) = 0.
Current usage metrics show cumulative count of Article Views (full-text article views including HTML views, PDF and ePub downloads, according to the available data) and Abstracts Views on Vision4Press platform.
Data correspond to usage on the plateform after 2015. The current usage metrics is available 48-96 hours after online publication and is updated daily on week days.
Initial download of the metrics may take a while.