Fig. 3
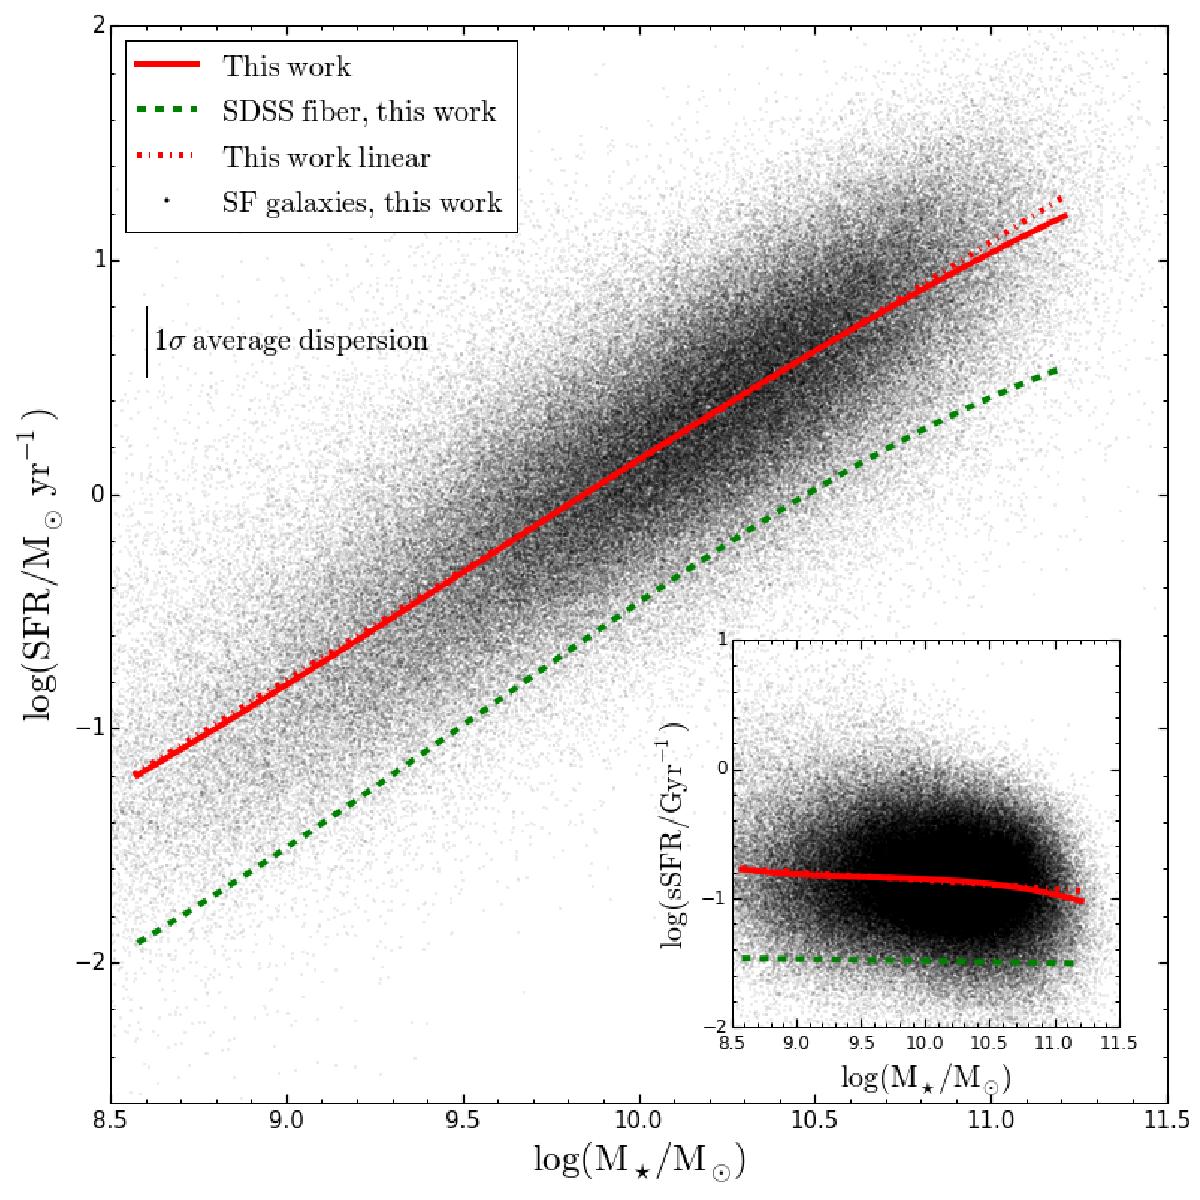
Relation between the SFR and M⋆ for star-forming galaxies. The red solid line and green dashed line represent the fit to the running median for bins of 2000 objects in this work and in the SDSS fibre, respectively. The red dotted line represents the linear fit to the running median for bins of 2000 objects in this work. The vertical black line shows the 1σ average dispersion (~0.3 dex). The inset plot shows the sSFR-M⋆ relation for our sample and the running median, for bins of 2000 objects, for the sSFR corrected for aperture (red solid line) and inside the SDSS fibre (green dashed line).
Current usage metrics show cumulative count of Article Views (full-text article views including HTML views, PDF and ePub downloads, according to the available data) and Abstracts Views on Vision4Press platform.
Data correspond to usage on the plateform after 2015. The current usage metrics is available 48-96 hours after online publication and is updated daily on week days.
Initial download of the metrics may take a while.