Fig. 2
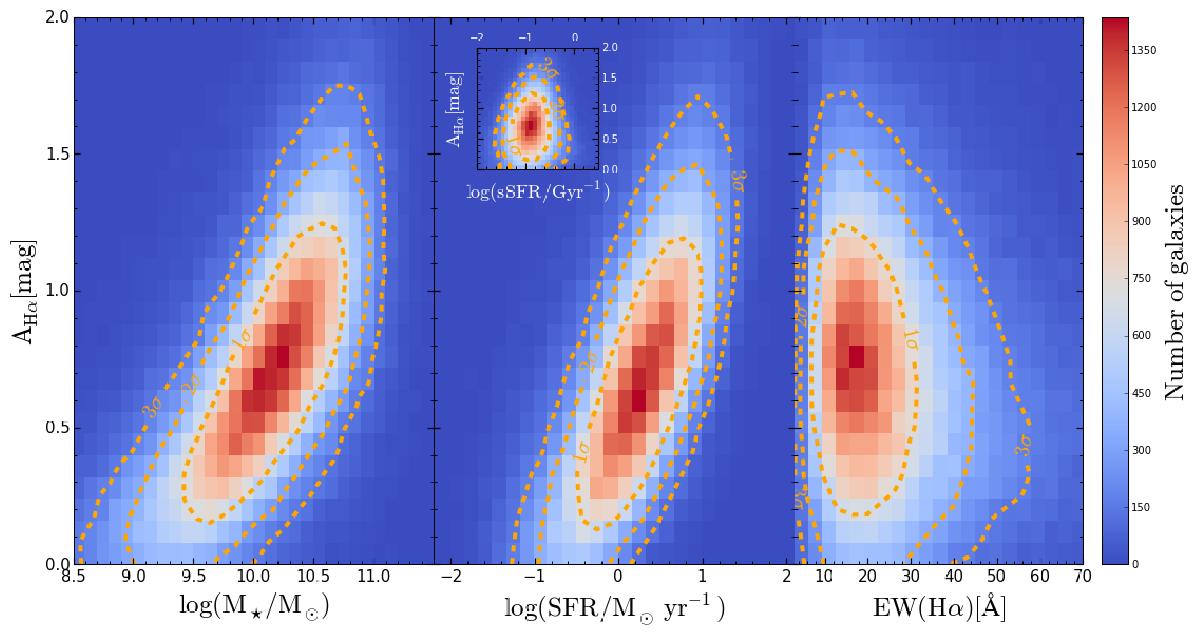
Density plots for the SDSS star-forming galaxies: i) left panel: the relation between log (M⋆/M⊙) and A(Hα); ii) central panel: the relation between log (SFR/M⊙ yr-1) and A(Hα), the inset plot shows the A(Hα)-log (sSFR/Gyr-1) relation; iii) right panel: the relation between EW(Hα) and A(Hα). The dashed lines represent the 1σ, 2σ, and 3σ contours.
Current usage metrics show cumulative count of Article Views (full-text article views including HTML views, PDF and ePub downloads, according to the available data) and Abstracts Views on Vision4Press platform.
Data correspond to usage on the plateform after 2015. The current usage metrics is available 48-96 hours after online publication and is updated daily on week days.
Initial download of the metrics may take a while.