Fig. 9
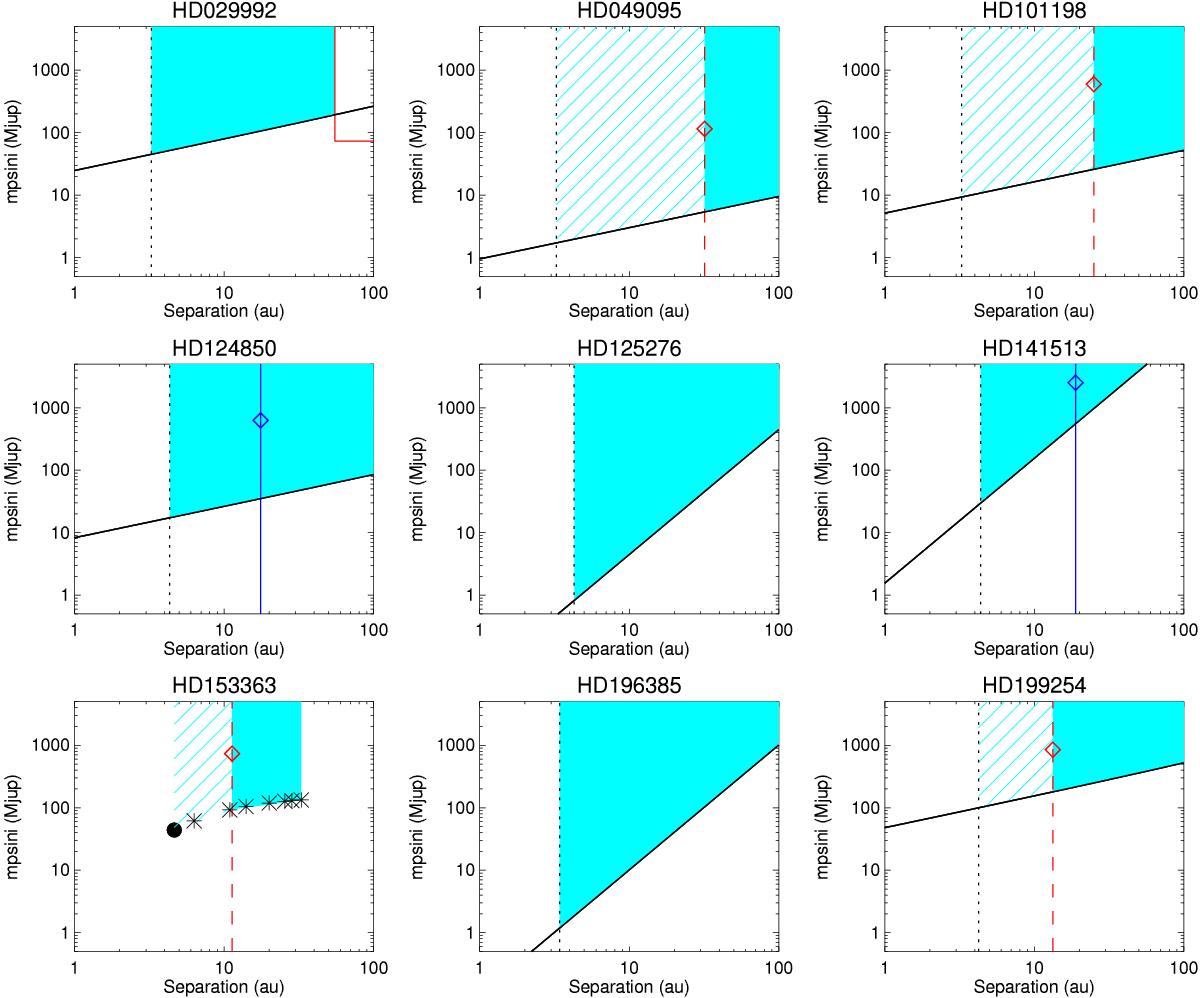
Limits on the orbital parameters (mpsini, sma) of the companions to our targets with long-term RV trends, given the observed RV variations. Black solid line: minimal mass vs. sma. Dotted black line: minimal sma given the observation time baseline (i.e., considering that the companion orbital period is at least equal to the time baseline, and assuming a circular orbit). In the case of HD 153363, the mass and sma corresponding to the Keplerian fit derived with yorbit with all parameters free is shown as a black filled dot, and the masses and sma corresponding to the yorbit fits obtained for longer periods are showed as black crosses. The area filled and/or shaded in cyan corresponds to the (mass, sma) domain based on these constraints. Dashed red line: projected separation of the imaged companion (if any), resulting possible mass from the DI study (red diamond), or DI detection limits (solid red line). HD 29992, HD 49095, HD 101198, HD 153363: DI from E10. HD 199254: DI from De Rosa et al. (2014). Blue solid line: sma of the companion detected through astrometric measurements, and mass estimation (blue diamond). HD 124850: astrometry from Gontcharov & Kiyaeva (2010); HD 141513: from Malkov et al. (2012).
Current usage metrics show cumulative count of Article Views (full-text article views including HTML views, PDF and ePub downloads, according to the available data) and Abstracts Views on Vision4Press platform.
Data correspond to usage on the plateform after 2015. The current usage metrics is available 48-96 hours after online publication and is updated daily on week days.
Initial download of the metrics may take a while.