Fig. 4
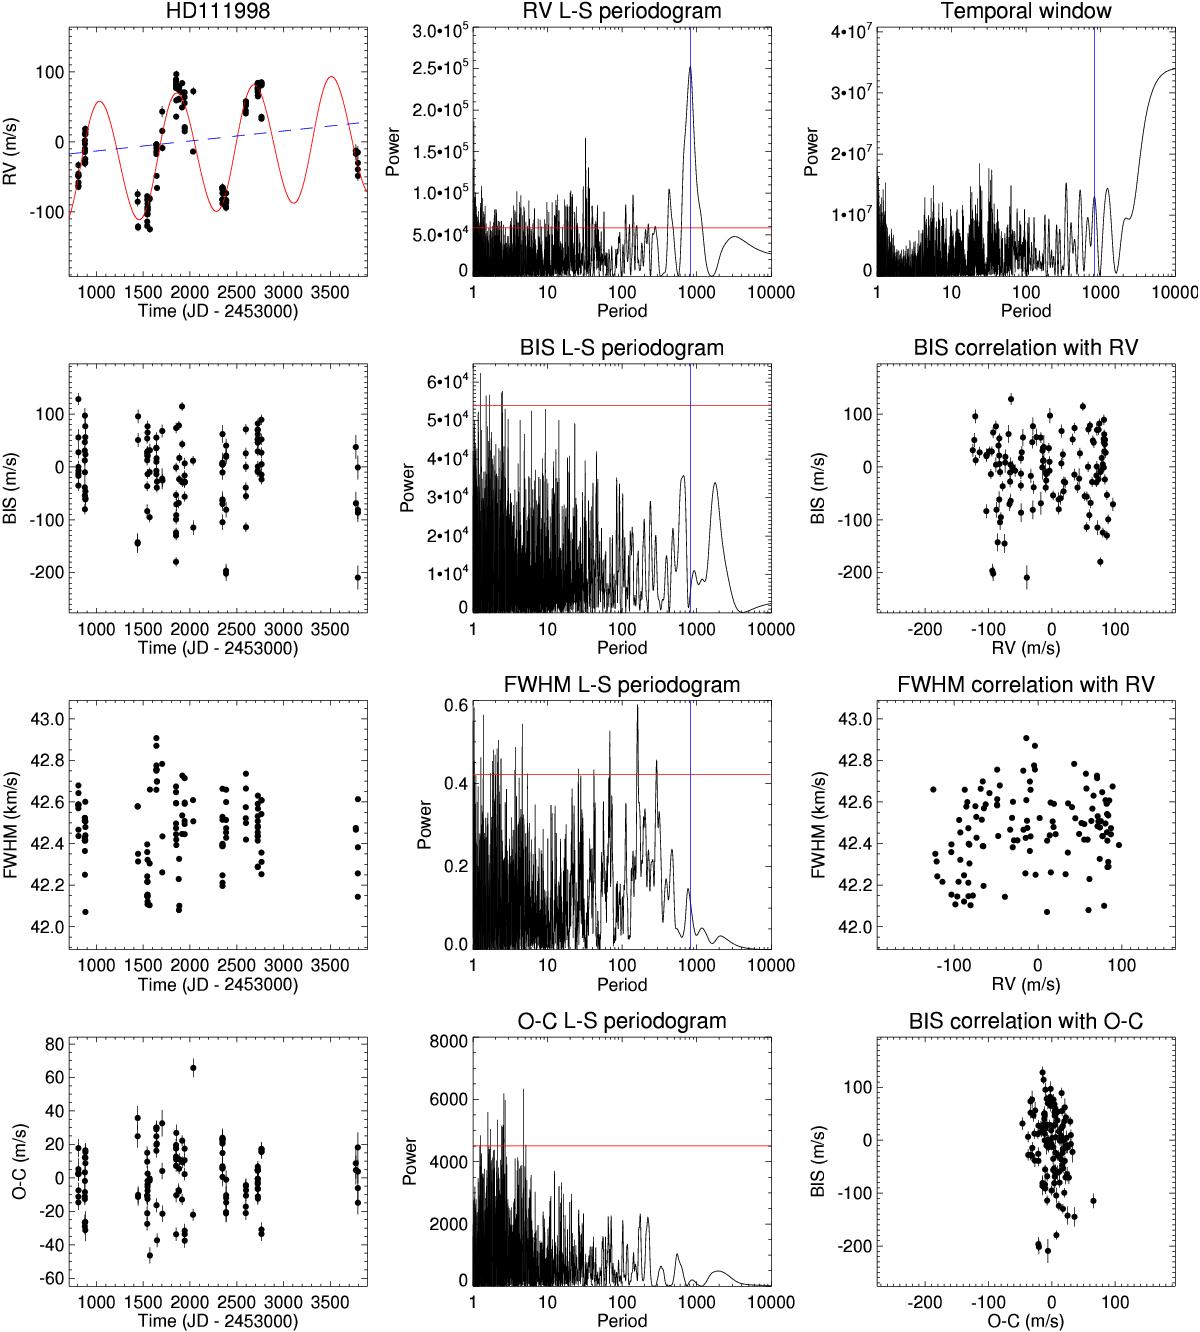
Spectroscopic data for HD 111998. Top row: HD 111998 RV time series (left), RV Lomb-Scargle periodograms (middle) and temporal window of the observations (right). The Keplerian fit is superimposed (red solid line) to the RV, as well as the linear trend (dashed blue line). On the RV periodogram, the FAP at 1% (solid line) is indicated in red; the planet period is indicated in blue. Second and third rows: BIS and FWHM time series, corresponding Lomb-Scargle periodograms and correlations with the RV data. Fourth row: Residuals of the fit as a function of time, periodogram of the residuals and BIS correlation with the residuals.
Current usage metrics show cumulative count of Article Views (full-text article views including HTML views, PDF and ePub downloads, according to the available data) and Abstracts Views on Vision4Press platform.
Data correspond to usage on the plateform after 2015. The current usage metrics is available 48-96 hours after online publication and is updated daily on week days.
Initial download of the metrics may take a while.