Fig. 12
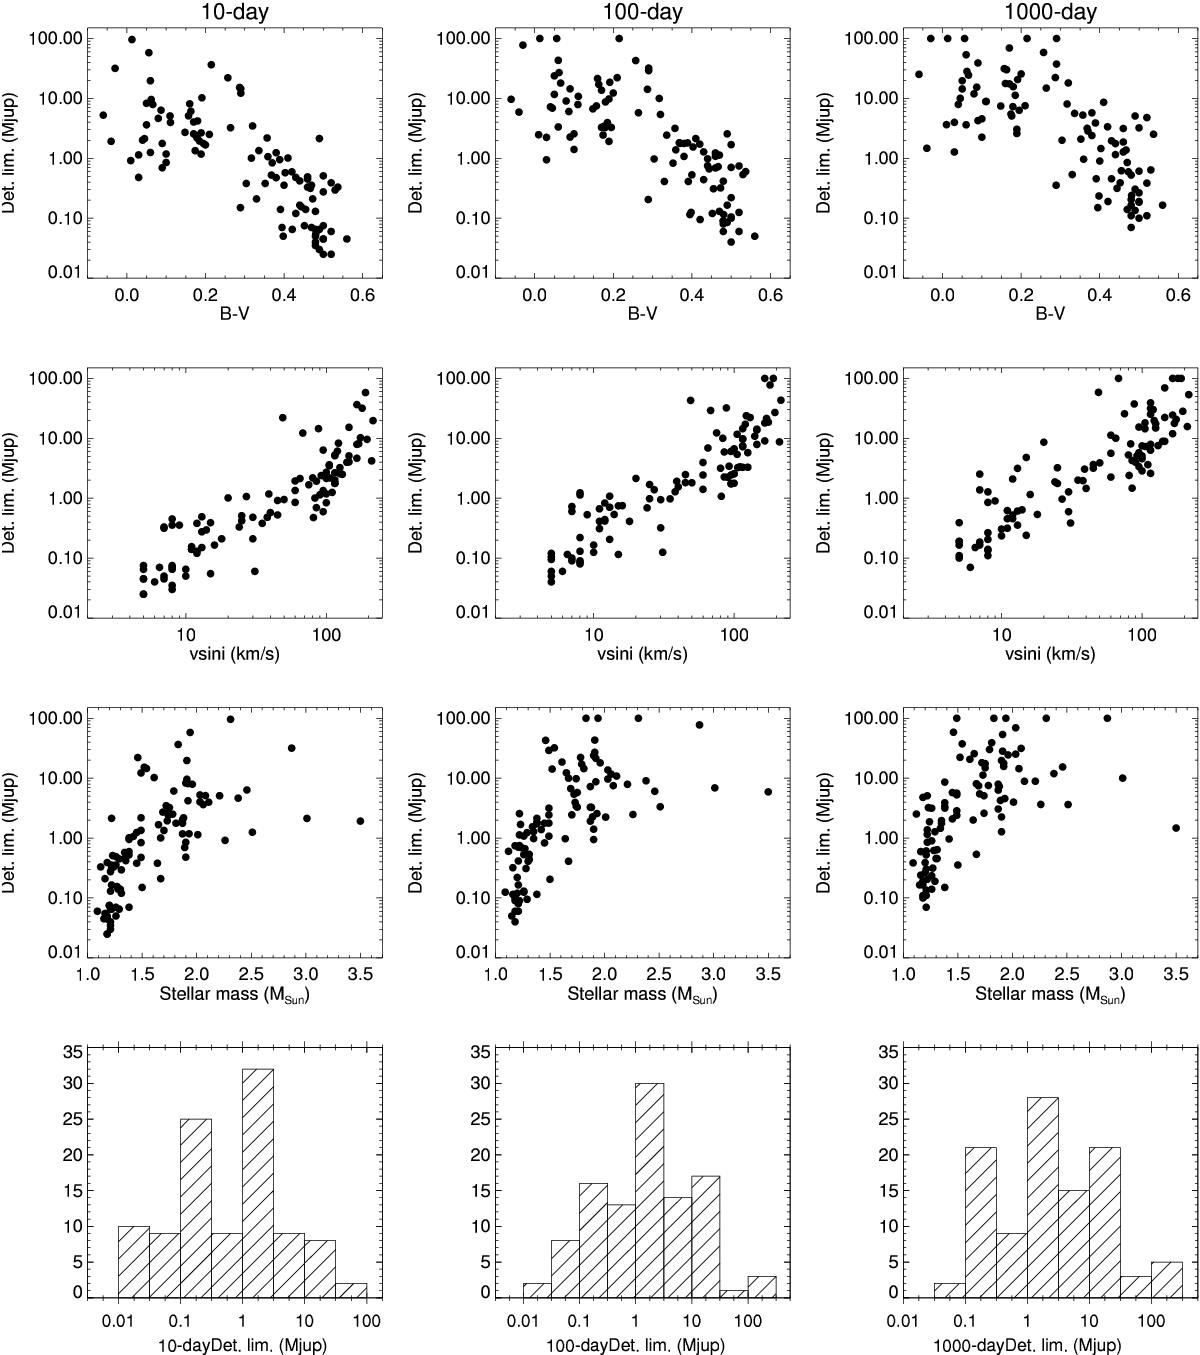
Achieved detection limits for our sample versus main stellar parameters. For all panels, each black dot represents the detection limit for one target. All targets are displayed except for stars with detected GP companions. Left: mean detection limit in the range 1–10 days; middle: mean detection limit in the range 10–100 days; right: mean detection limit in the range 100–1000 days. Top: detection limits vs. B−V; middle top: vs. vsini; middle bottom: vs. M⋆; bottom: in histograms.
Current usage metrics show cumulative count of Article Views (full-text article views including HTML views, PDF and ePub downloads, according to the available data) and Abstracts Views on Vision4Press platform.
Data correspond to usage on the plateform after 2015. The current usage metrics is available 48-96 hours after online publication and is updated daily on week days.
Initial download of the metrics may take a while.