| Issue |
A&A
Volume 599, March 2017
|
|
|---|---|---|
| Article Number | A78 | |
| Number of page(s) | 9 | |
| Section | Galactic structure, stellar clusters and populations | |
| DOI | https://doi.org/10.1051/0004-6361/201628778 | |
| Published online | 02 March 2017 | |
A new L5 brown dwarf member of the Hyades cluster with chromospheric activity⋆
1 Dpto. Física Aplicada, Universidad Politécnica de Cartagena, 30202 Cartagena, Murcia, Spain
e-mail: This email address is being protected from spambots. You need JavaScript enabled to view it.
2 Instituto de Astrofísica de Canarias (IAC), Calle Vía Láctea s/n, 38200 La Laguna, Tenerife, Spain
3 Departamento de Astrofísica, Universidad de La Laguna (ULL), 38206 La Laguna, Tenerife, Spain
4 Consejo Superior de Investigaciones Científicas, CSIC, Spain
Received: 22 April 2016
Accepted: 14 December 2016
Abstract
Aims. Our aim is to identify brown dwarf members of the nearby Hyades open star cluster to determine the photometric and spectroscopic properties of brown dwarfs at moderately old ages and extend the knowledge of the substellar mass function of the cluster.
Methods. We cross-matched the 2MASS and AllWISE public catalogues and measured proper motions to identify low-mass stars and brown dwarf candidates in an area of radius eight degrees around the central region of the Hyades cluster. We identified objects with photometry and proper motions consistent with cluster membership. For the faintest (J = 17.2 mag) most promising astrometric and photometric low-mass candidate 2MASS J04183483+2131275, with a membership probability of 94.5%, we obtained low-resolution (R = 300−1000) and intermediate-resolution (R = 2500) spectroscopy with the 10.4m Gran Telescopio Canarias.
Results. From the low-resolution spectra we determined a L5.0 ± 0.5 spectral type, consistent with the available photometry. In the intermediate dispersion spectrum we detected Hα in emission (marginally resolved with a full width half maximum of ~2.8 Å) and determined a log (LHα/Lbol) = −6.0 dex. From Hα we obtained a radial velocity of 38.0 ± 2.9 km s-1, which combined with the proper motion leads to space velocities which are fully consistent with membership in the Hyades cluster. We also report a detection in the H2 band by the UKIDSS Galactic Plane Survey. Using evolutionary models we determine from the available photometry of the object a mass in the range 0.039−0.055 M⊙. Brown dwarfs with masses below 0.055 M⊙ should fully preserve its initial lithium content, and indeed the spectrum at 6708 Å may show a feature consistent with lithium preservation; however, a higher S/N is needed to confirm this point.
Conclusions. We have identified a new high-probability L5 brown dwarf member of the Hyades cluster. This is the first relatively old L5 brown dwarf with a well-determined age (500−700 Myr) and measured chromospheric emission.
Key words: stars: low-mass / open clusters and associations: individual: Hyades / techniques: photometric / techniques: spectroscopic / surveys
Based on observations made with the Gran Telescopio de Canarias (GTC) installed at the Spanish Observatorio del Roque de los Muchachos of the Instituto de Astrofísica de Canarias, on the island of La Palma.
© ESO, 2017
1. Introduction
Brown dwarfs are objects with masses below 0.075 M⊙ unable to reach high enough temperatures in their cores to trigger hydrogen fusion (Burrows & Liebert 1993; Chabrier & Baraffe 1997). The absence of stable hydrogen burning causes the physical properties of brown dwarfs to change drastically as a function of mass and age. Dynamical determination of masses has been possible for a growing list of binary brown dwarfs (e.g. Zapatero Osorio et al. 2004; Dupuy & Liu 2012), but the age is also required to fully constrain evolutionary models of substellar objects (Baraffe et al. 1998, 2015; Siess et al. 2000; Feiden et al. 2015). The characterization of brown dwarf members of open star clusters of well-known age is of capital importance because we are provided with snapshots of the physical properties (colours, luminosities, spectral energy distributions) of these objects at given ages. Searches in star-forming regions and young clusters have revealed brown dwarfs with ages from a few Myr to a few hundred Myr (see reviews by Bastian et al. 2010; Luhman 2012).
Older star clusters (>500 Myr) like the Hyades (Melotte 25, α2000 = 04h26m54s, δ2000 = +15°52′) offer a unique opportunity to find examples of relatively old brown dwarfs with well-determined age and metallicity. The Hyades has a mean distance of 46.3 ± 0.3 pc and is the closest open star cluster to the Sun (van Leeuwen 2009). The Hyades exhibit a significant mean proper motion: μ = ~ 74–140 mas/yr, PA = 90°−135° (Bryja et al. 1994), a tidal radius of ~10 pc, and a core radius of 2.5–3.0 pc (Perryman et al. 1998). Owing to its proximity, the cluster spans a large area over the sky (several hundred square degrees). The age of the Hyades is 625 ± 50 Myr based on the comparison of the observed cluster sequence with model isochrones, although a wider age range cannot be discarded (Mermilliod 1981; Eggen 1998). The metallicity of high-mass members appears slightly super-solar, around [Fe/H] ~ 0.13–0.14 dex (Boesgaard & Friel 1990) although a more recent work by Gebran et al. (2010) suggests a mean solar metallicity.
Hogan et al. (2008) reported a number of L dwarf candidates in the Hyades cluster based on photometry and proper motions. They identified 12 objects with colours resembling those of field L dwarfs. Recently, Casewell et al. (2014) and Lodieu et al. (2014) presented spectroscopic follow-up confirming the cool nature of most of the candidates reported by Hogan et al. (2008), although these authors did not unambiguously determine whether these objects are brown dwarfs or very low-mass stars. Bouvier et al. (2008) discovered the first two T-type dwarfs in the Hyades cluster based on low-resolution infrared spectra. These cool objects are very likely brown dwarfs. Based on the shape of the mass function, Bouvier et al. (2008) argued that ~15 brown dwarfs could exist in the present-day Hyades cluster and are yet to be uncovered. In addition to 2MASSI 023301.55+2470406 (Cruz et al. 2007), which was proposed as a L0 member of the Hyades (Goldman et al. 2013), a few other known L/T dwarfs listed with spectra and proper motions in the compendium of ultracool dwarfs1 could be associated with the Hyades moving group (Bannister & Jameson 2007; Gagné et al. 2015) and therefore could be relatively old.
In this paper, we present the finding of a new mid-L dwarf, 2MASS J04183483+2131275 (hereafter 2M0418+21) with photometry, spectroscopy, proper motion, and radial velocity consistent with membership in the Hyades cluster. Furthermore, it presents signs of chromospheric activity with a clear detection of Hα in emission on 19 December 2015 for a few hours. In Sect. 2 we describe our search for new very low-mass members of the Hyades. In Sect. 3 we present spectroscopic observations of the most promising candidate found 2M0418+21 conducted with the Gran Telescopio de Canarias (GTC). In Sect. 4 we analyse the optical spectra and put our results in context with other low-mass stars and brown dwarfs.
2. New very low-mass proper motion member of the Hyades
2.1. Catalogue cross-match
We cross-matched the Two Micron All Sky Survey (2MASS; Cutri et al. 2003; Skrutskie et al. 2006) point source catalogue and the AllWISE mid-infrared catalogue built upon the Wide-field Infrared Survey Explorer mission (WISE; Wright et al. 2010) to identify new low-mass stars and substellar members in the Hyades cluster. Details of this cross-match will be presented in a future paper (Pérez-Garrido et al., in prep.). Given the temporal baseline between the two surveys (~11−14 yr) we conducted an astrometric search to identify objects with mean displacements larger than 100 mas/yr. In our search, we looked for pairs of uncorrelated objects in 2MASS and WISE in a Hyades region of radius 8 degrees centred at 04h26m54s, +15°52′. Uncorrelated objects are those which are present in one catalogue with no counterpart in the other database within a correlation radius of one arcsec. In a subsequent step, we selected objects with apparent proper motions measured between both catalogues of 70 <μαcosδ < 130 mas/yr in right ascension and −60 < μδ < 0 mas/yr in declination. These pairs represent candidates with proper motions comparable to those of Hyades members (Fig. 1). This correlation returned 130 objects with proper motions and near-infrared photometry compatible with cluster membership (Figs. 1, 4). We recovered several L dwarf candidates (Hogan et al. 2008) with spectroscopic follow-up (Casewell et al. 2014; Lodieu et al. 2014). A subset of those 130 candidates found in our search also have optical photometry in the Sloan Sky Digital Survey (York et al. 2000). Remarkably, we identified a new object whose colours measured by 2MASS, WISE, and the Sloan Digital Sky Survey (SDSS; York et al. 2000) were indicative of a mid-L dwarf (Fig. 4, Table 1) that is cooler and significantly fainter than other previously reported Hyades L dwarfs. In Sect. 3 we present the optical spectral classification of this object.
2.2. Proper motion computation
The proper motion of 2M0418+21 was obtained using the 2MASS, AllWISE, and UKIDSS GCS catalogues and simply calculated as μα = Δαcosδ/ Δt and μδ = Δδ/ Δt, where Δα and Δδ are the differences between RA and Dec in any two catalogues. We note that we used the set of coordinates not corrected for proper motion in the AllWISE catalogue. In order to assess the error in our measurement for each pair of catalogues we determined the proper motions of all objects placed 30 arcmin around 2M0418+21. We estimate the error, σ, from the full width half maximum of each bell-shaped proper motion histogram (2.3 times σ). We discarded the proper motion measurements from the AllWISE vs. UKIDSS GCS pairs owing to the short baseline between the two observations as it yielded large error bars (~60 mas/yr). For the other two pairs of catalogues we obtained errors of ~8 mas/yr and the initial resulting 2M0418+21 proper motions were (129, −53) mas/yr and (133, −44) mas/yr for 2MASS-AllWISE and 2MASS-UKIDSS GCS, respectively. However, for the Hyades objects a correct estimation of the proper motion requires taking into account parallactic motion. We removed this parallactic effect using the Earth’s barycentre coordinates for each catalogue epoch, assuming a distance of 48.8 pc. We then performed a linear regression with the new coordinates from 2MASS, UKIDSS, and WISE AllSky (we did not use AllWISE since its astrometry is an average spanning several months), and the resulting fit yielded a final proper motion of (124 ± 7, −53 ± 6) mas/yr for our object.
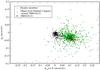 |
Fig. 1 Proper motion diagram of the Hyades cluster. Green triangles correspond to Hyades members (Goldman et al. 2013) and the solid square corresponds to 2M0418+21. Black dots corresponds to objects in the Simbad database within a circular radius of 2 degrees around 2M0418+21. |
2.3. Hyades membership
All members of the Hyades cluster seem to move towards the cluster convergent point (CP) located at αCP = 6h29.48m, δCP = 6°53′.4 (Madsen et al. 2002). The angle θ from this object to the convergent point (measured as the angle between the line pointing to the north and the line to the CP) can be calculated as in Hogan et al. (2008). This angle should be compared to the proper motion angle, θPM. Values for these angles with differences below 12° would indicate that our object is moving towards the Hyades CP. In our case we get θ =110° and θPM = 113°. We also calculate a proper motion distance of 41.7 pc using Eq. (3) of Hogan et al. (2008). Both estimations are in good agreement with what we expect for Hyades members (van Leeuwen 2007).
Furthermore, we use the maximum likelihood method described in Sanders (1971) to assess the Hyades membership probability of 2M0418+21. This method assumes two overlapping normal bivariate frequency functions, one for field stars and one for the cluster. In our implementation we input the known proper motion of the Hyades cluster, μα = 115 and μδ = −40 (mas/yr), and let the algorithm estimate the mean proper motion of field objects. We considered all point sources within a radius of 30 arcmin around 2M0418+21, finding a membership probability of 94.5% for 2M0418+21. Therefore, this object can be considered from both photometry and proper motion as a member of the Hyades cluster.
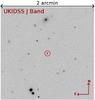 |
Fig. 2 Finding chart of 2M0418+21 in J band from UKIDSS Galactic Cluster Survey. |
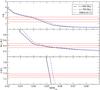 |
Fig. 3 J−K, W1−W2, and J−W2 colour as a function of mass from the AMES-Dusty evolutionary model. The dashed red line with the bottom and top red line represent the W1−W2 (AllWISE) and J−K (UKIDSS) colours of 2M0418+21 with their error bars. |
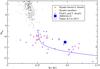 |
Fig. 4 (W1−W2, MW2) colour-magnitude diagram depicting known L dwarfs in the Hyades (red squares; Hogan et al. 2008; Casewell et al. 2014; Lodieu et al. 2014), Hyades high-mass and low-mass members (black dots; Goldman et al. 2013), the mean sequence of field L and T dwarfs shifted to 46.3 pc (purple line; Dupuy & Liu 2012), and our target 2M0418+21 (solid square; this work). |
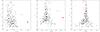 |
Fig. 5 Left: (J−H2, J) colour-magnitude for all point sources within 5 arcmin of 2M0418+21 highlighted by a large red dot. Middle: same but for (H−H2, H). Right: same but for (K−H2, K). Hyades members from Goldman et al. (2013) and field L/T dwarfs with H2 photometry from the UKIDSS GPS are plotted as red and blue open squares, respectively. |
2.4. Additional photometry
In addition to the JHKs near-infrared photometry from 2MASS and mid-infrared data from WISE, 2M0418+21 is also covered by the Sloan Sky Digital Survey Data Release 9 (York et al. 2000; Ahn et al. 2012) and the UKIRT Infrared Deep Sky Survey (UKIDSS; Lawrence et al. 2007) Galactic Clusters Survey and Galactic Plane Surveys. 2M0418+21 is detected in the Sloan z band only and in various filters from UKIDSS with two distinct epochs (1 December 2005 for K1 and 29 November 2005 for K). We summarize the photometry available for 2M0418+21 in Table 1 and display a J-band finding chart from UKIDSS in Fig. 2.
We checked the H2(1–0)-band image obtained by the UKIDSS Galactic Plane Survey on 29 November 2005. The DR10 catalogue gives a magnitude of 15.247 ± 0.029 mag with an ellipticity below 0.06 and roundness parameters indicating a point source. However, 2M0418+21 stands out in the (J−H2, J) and (H−H2, H) colour-magnitude diagrams in comparison to other point-like objects within five arcmin (Fig. 5). Its J−H2 and H−H2 colours are redder than any other point source in the field (Fig. 5). However, its location in the (K−H2, K) colour-magnitude diagram fits the main sequence of point sources well (right side plot in Fig. 5). The H2(1−0) is centred at 2.12 microns with a 50% cut-off of 0.1 microns, and is usually used to probe the presence of molecular emission from circumstellar disks. We do not see any obvious presence of a jet in the 5 arcmin image. We have checked the Herschel and ALMA archives, but the search did not return any public image at the time of writing so we cannot discuss further the presence or absence of a disk around 2M0418+21.
We added two samples of objects in Fig. 5 to place the H2 photometry of 2M0418+21 in context. We cross-matched the full list of Hyades members from Goldman et al. (2013) with the UKIDSS GPS DR10 and found 79 sources with H2 photometry (red open squares in Fig. 5). However, only a handful have magnitudes fainter than 12 mag. Only one source has an H2 magnitude fainter than 13 mag, safely below the saturation limits of the UKIDSS shallow surveys (Lodieu et al. 2007). We also included two L dwarfs covered by the GPS among all field L/T dwarfs listed in the compendium of ultracool dwarfs2. One object is 2MASSW J0326137+295015 classified in the optical as a L3.5 dwarf (Kirkpatrick et al. 1999) with a trigonometric distance of 32.2 pc and a mean proper motion of 69.4 ± 0.8 mas/yr with a position angle of 344.3 ± 0.7 degrees (Dahn et al. 2002). The proper motion of this source is lower than the average motion of Hyades members with a discrepant position angle and it lies closer than the Hyades, arguing against its membership in the Hyades. The other source is 2MASSI J0409095+210439 (L3.0; Kirkpatrick et al. 2000). This object lies close to the centre of the Hyades cluster and has a proper motion of 101 ± 15, −148 ± 12 mas/yr (Casewell et al. 2008) and a spectrophotometric distance of 35.9−39.8 pc, which makes it a potential L dwarf member of the Hyades cluster. We observe a possible trend of redder J−H2 and H−H2 colours with later spectral types in the L dwarf regime.
2.5. Mass estimate
In Fig. 3 we compare the colours of 2M0418+21 with predictions for brown dwarfs of various masses at the age of the Hyades using the evolutionary models of the Lyon group (Allard et al. 2001; Chabrier et al. 2000). Each colour gives a slightly different mass estimation: 0.044 M⊙, 0.046
 M⊙, and
  M⊙ for J−K, W1−W2, and J−W2, respectively. We infer a likely mass between 0.039–0.055 M⊙ with an average value of 0.048
 M⊙ for 2M0418+21. To summarize, we have identified a highly probable brown dwarf member of the Hyades cluster.
Compilation of the photometry for 2M0418+21.
3. Spectroscopic observations
We collected several optical spectra with three different gratings installed on the OSIRIS (Optical System for Imaging and low-intermediate Resolution Integrated Spectroscopy; Cepa et al. 2000) spectrograph on the 10.4 m GTC in La Palma to characterize the target. OSIRIS is equipped with two 2048 × 4096 Marconi CCD42-82 detectors offering a field of view of approximately 7 × 7 arcmin2 with a binned pixel scale of 0.25 arcsec.
3.1. Low-resolution optical spectroscopy
We obtained two low-resolution optical spectra of 2M0418+21 with the R300R grating on GTC/OSIRIS on the nights of 25 and 26 January 2015 under filler program GTC51–14B (PI Lodieu). We used an on-source integration of 1800 s for both spectra with the following configuration: slit of 1 arcsec and 2 × 2 binning. The observations were obtained under a seeing of 1.3 arcsec, with grey sky and clear conditions.
We collected two new optical spectra of 2M0418+21 with the R1000R grating on GTC/OSIRIS as part of filler program GTC38–15A (PI Lodieu). We used the same configuration as above, except for the grating which offers a resolution that is higher by approximately a factor of 3. We set the on-source integration to 1800 s, repeated twice with a shift of 10 arcsec (equivalent to 40 pixels) along the slit. The seeing was poor, around 1.8 arcsec, but the sky was clear and the moon was within 7 days of new moon.
We reduced the optical spectra under the IRAF environment (Tody 1986, 1993) in a standard manner. First, we median-combined the bias and flat fields taken during the afternoon. We subtracted the mean bias from the raw spectrum of the target and divided by the normalized flat field. We extracted the 1D spectrum by optimally choosing background level. We calibrated the 1D spectra with the response function derived from the spectrophotometric standard star Ross 640 (DZ5; Harrington & Dahn 1980; Monet et al. 2003; Cutri et al. 2003; Lépine & Shara 2005; Sion et al. 2009). The final spectra of 2M0418+21, normalized at 7500 Å, are displayed in Fig. 6 along with known L dwarf spectra templates from the literature (Schmidt et al. 2010; Fan et al. 2000; Leggett et al. 2002; Geballe et al. 2002).
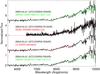 |
Fig. 6 Low-resolution optical spectra of 2M0418 obtained with the R300R (three spectra) and R1000R (third from bottom) gratings on GTC/OSIRIS (black lines). The continuum of the spectra are offset vertically by 1.5 for visualization purposes. From top to bottom: we overplotted the spectra of 2MASS J00361617+1821104 (L4; green), the Sloan dwarf template (L5; red), the spectrum of SDSS J053952−005902 (L5; red), and 2MASS J08251968+2115521 (L6; green). See text for details. |
3.2. Medium-resolution optical spectroscopy
Following the analysis of the low-resolution spectra, we requested a dedicated program to take optical spectra with the highest resolution grating available (R2500R) on GTC/OSIRIS, offering a resolution of ~2400 at 6600 Å with a slit of 1 arcsec. We secured five groups of two spectra of 30 min on-source each shifted along the slit by 10 arcsec, yielding a total on-source exposure of 5h. The observations were taken on the night of 19 December 2015 under a variable seeing of 1.3–1.5 arcsec, spectroscopic conditions, and the moon illuminated at 65% located at 50 degrees from our target.
We reduced the R2500R spectra under the IRAF environment (Tody 1986, 1993) taking advantage of the fact that all spectra were obtained consecutively on the same night. We subtracted each pair of optical spectra to remove the contribution of the sky. Then, we averaged the five spectra at the nominal position (“first frame”) and the shifted position (“second frame”) rejecting the lowest and highest values to create a combined spectrum at each position. Later, we combined the two frames by shifting the second frame to the first one. The final 2D image is shown at the top of Fig. 7, where the Hα emission line stands out as a white dot with a signal-to-noise of 10 on top of a very faint continuum with a signal-to-noise of ~2 per spectral resolution element of 2.6 Å.
We optimally extracted the spectrum by selecting the nominal position fitting the background without cosmic rays rejection. We calibrated our spectrum in wavelength by fitting a 1D polynomial to 20 arc lines with a dispersion of 1.03 Å/pixel and a rms of 0.05 Å, corresponding to radial velocity precisions of ~2.3 km s-1. We calibrated this spectrum with the response function of the detector+grating derived from the spectrophotometric standard star Feige 110 (Høg et al. 2000; van Leeuwen 2007; Drilling et al. 2013). The final 1D spectrum of 2M0418+21 is displayed in Fig. 7. The emission line corresponds to Hα at 6563 Å. There is no evidence of Hα emission in the spectrum gathered with the R300R grism; however, data from the R1000R grism show signs of Hα in emission with a pseudo-equivalent width (pEW) between 4–10 Å, although its low signal-to-noise ratio does not make it a reliable detection.
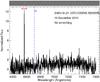 |
Fig. 7 Bottom: combined 1D optical spectrum of 2M0418+21 taken with the R2500R grating on GTC/OSIRIS on 19 December 2015. No smoothing was applied. Top: final combined 2D image of the R2500R spectrum of 2M0418+21. The white dot on the left-hand side corresponds to the Hα emission. The faint continuum is barely seen, but is present. |
4. Analysis
4.1. Spectral classification and spectroscopic distance
The overall appearance of the 2M0418+21 low-resolution spectrum displayed in Fig. 6 suggests a mid-L dwarf. To derive a spectral type with better accuracy, we compared our GTC/OSIRIS spectrum with the Sloan L dwarf template publicly available for each subclass (Schmidt et al. 2010, 2014). We find the L5 SDSS template (red line) provides the best fit to our spectrum (black line) up to 9000 Å (Fig. 6). We also compared our optical spectrum to a set of spectral templates listed on Sandy Leggett’s webpage3 and discovered by the Sloan team (Knapp et al. 2004; Golimowski et al. 2004; Chiu et al. 2006), including 2MASS J00361617+1821104 (L4; Reid et al. 2000; Kirkpatrick et al. 2000; Knapp et al. 2004), LHS 102B (L4.5–L5 (binary); EROS Collaboration et al. 1999; Henry et al. 2006; Kirkpatrick et al. 2001), SDSS05395199−0059020 (L5), SDSS13262982−0038315 (L5.5; Fan et al. 2000; Vrba et al. 2004) and 2MASS08251968+2115521 (L6; Kirkpatrick et al. 2000; Dahn et al. 2002). We find the best match for the L5 dwarf up to 10 000 Å, as in the case of the SDSS templates. The L4 and L6 dwarfs are bluer and redder beyond 8800 Å, respectively (Fig. 6). The L6 has a much straighter redward spectrum than our target, marked by the presence of the FeH bands at ~8700 Å and the H2O band at ~9300 Å. As a consequence, we derive an uncertainty of half a subclass for our optical spectral classification by comparison with the mid-L dwarf standards.
Assuming the spectral type vs. absolute magnitude relation for L5 dwarfs from Dupuy & Liu (2012) in all five passbands available for 2M0418+21, we derive spectrophotometric distances of 57.8, 53.1, 50.1, 42.3, and 40.6 pc in J, H, K, w1, and w2, respectively, with typical errors in the 5−10 pc range. These error bars take into account the uncertainty of 0.5 class in the spectral type. We observe a trend towards closer distances with redder wavelengths. Averaging all these measurements with equal weights because we assume that the polynomial fits in each filter represent independent measurements, we infer a mean distance of 48.8 ± 4.0 pc. The error on the distance is rms on the distance divided by the square root of 5 (the number of measurements). We assume that 2M0418+21 is single. Our mean value is close to the accepted distance of the Hyades cluster from Hipparcos (46.3 ± 0.3 pc; van Leeuwen 2009).
4.2. Hα emission
We detected a clear emission line present in each individual spectrum at the nominal position of Hα (6562.8 Å) over the full time of observations, from UT = 22h to UT = 1h40 (Fig. 7). This is the first detection of Hα in emission in a mid-L dwarf classified as a high-probability photometric, astrometric, and spectroscopic candidate member of the Hyades cluster. However, comparable levels of activity have been reported in field L dwarfs (Schmidt et al. 2015; Pineda et al. 2016).
We measured the ratio of Hα to bolometric luminosity for our target following the method outlined in Burgasser et al. (2011). We calibrated the flux of 2M0418+21 with the spectrophotometric standard star Feige 110 observed with GTC/OSIRIS on the same night. We considered the R-band magnitude of Feige 110 (11.70 mag; Landolt & Uomoto 2007) because it contains the Hα line. In this passband our target is ~30 000 times fainter than Feige 110. We assumed a bolometric correction in the K band of 3.3 for a L5 dwarf (Golimowski et al. 2004) and assumed a solar bolometric luminosity of Mbol = 4.74. We used the distance of 48.8 pc for 2M0418+21 (see previous section). We infer a value of log 10(LHα/Lbol) = −6.0 dex, consistent with the drop in activity seen from late-M to mid-L dwarfs (see e.g. Fig. 5 of Berger et al. 2010). Owing to the cluster age we can discard accretion as the origin of this emission and postulate chromospheric activity as its cause.
2M0418+21 represents an important addition to the sample of L5 dwarfs with detected Hα emission and log 10(LHα/Lbol) measurements because its age is well constrained to 625 ± 50 Myr. We collected a large number of L4.5–L5.5 with reported Hα pEWs, yielding a wide range of values in log 10(LHα/Lbol). The highest values can reach up to −3.7 dex, while the faintest upper limit lies around −7.5 dex. Reiners & Basri (2008) looked at one L4.5 and three L5 and placed upper limits on the log 10(LHα/Lbol). The sample of SDSS L5 dwarfs includes 10 L4.5, 24 L5, and 2 L5.5 sources with seven detections of Hα in emission, and three classified as variable (Schmidt et al. 2007, 2015). In their sample, Pineda et al. (2016) included three L5 with Hα in emission in one of them. They inferred a fraction of emitters of 20% (15–35%; 68% confidence limit), consistent with the interval from the SDSS sample (Schmidt et al. 2007, 2015) although to date there are few sources. We also note that a large number of L dwarfs show variability in their level of chromospheric activity (Liebert et al. 2003; Reiners & Basri 2008; Schmidt et al. 2015; Pineda et al. 2016), the most striking case being the L5.5e+T7 binary 2MASSI J1315309−264951AB (L5.5; Hall 2002a; Gizis 2002; Burgasser et al. 2011, 2013, 2015).
4.3. Radial velocity and space motion
We measured the position of the Hα line in the 1D spectrum with the splot task under IRAF. We identified the line at 6564.11 Å with an error of 0.04 Å, while the nominal air wavelength from the NIST Atomic Spectra Database is 6562.819 Å. We should add in quadrature the error on our wavelength calibration (2.3 km s-1, see Sect. 3.2) and uncertainty due to the timespan in our observations (0.2 km s-1). We inferred a radial velocity of 38.0 ± 2.9 km s-1 (Table 2) after correcting for the rotation of the Earth, the motion of the Earth around the Earth-Moon barycentre, the orbit of the barycentre about the Sun, and motion of the Sun relative to the specified standard of rest. Our value is in close agreement with the mean values derived independently from the ground (39.1 ± 0.2 km s-1; Detweiler et al. 1984) and from space with Hipparcos (39.48 ± 0.30 km s-1; de Bruijne et al. 2001). We infer a space motion of [U,V,W] = [−42.92, −23.96, −0.72] km s-1 for 2M0418+21 (Table 2), in close agreement with the space motion of the cluster centre: [−41.1, −19.2, −1.4] km s-1 (van Leeuwen 2009).
According to Vizier, 2M0418+21 should have a Gaia G-band of 19.096 and should be included in the Initial Gaia Source List (Smart & Nicastro 2014), implying that precise coordinates and proper motions will be soon available since the second Gaia data release is expected at the end of 2017. However, based on the equation G−J ~ 0.244 × SpT − 12.6332 kindly provided by R. Smart, 2M0418+21 might have G ~ 20.4 mag, placing it at the faint end of the Gaia catalogue. Therefore, it is unclear at this stage whether its membership to the Hyades cluster will be settled by Gaia in the near future.
Results of our spectroscopic analysis.
4.4. Lithium absorption
The lithium test was proposed in the early 1990s to distinguish between very low-mass stars and brown dwarfs (Rebolo et al. 1992; Magazzu et al. 1993). The technique relies on the detection of lithium in absorption at 6707.8 Å for late-M and L dwarfs straddling the stellar-substellar boundary. If lithium is detected, the object is substellar.
Brown dwarf evolutionary models predict a lithium conservation of 95% for 0.050 M⊙ brown dwarfs independent of age, whereas a 0.055 M⊙ should conserve 50% of its initial Li content and a 0.060 M⊙ should have totally destroyed lithium at the age of the Hyades. In Fig. 8 we show the predicted lithium depletion/preservation as a function of mass at the age of the Hyades. The observation of the lithium feature at 6707.8 Å in mid-L dwarfs could potentially provide a critical test of consistency: models reproduce both the atmospheric properties (i.e. colours) and the physics of the interior described by the lithium content for the same mass. Many nearby old field L dwarfs show lithium in absorption with more than 60% of L dwarfs with spectral types later than L5 having pseudo-equivalent widths greater than 10–15 Å, suggesting that the great majority of >L5 dwarfs are brown dwarfs.
Can lithium be detected in a mid-L dwarf at the age of the Hyades? There are several detections of the lithium resonance doublet at 6707.8 Å reported in the literature for field L dwarfs with pEWs ranging from 1 Å to 20 Å (Kirkpatrick et al. 2000, 2008; Cruz et al. 2009; Zapatero Osorio et al. 2014). For instance, Faherty et al. (2014) and Lodieu et al. (2015) have reported the detection of lithium in the two components of the nearest binary (L7–T0) brown dwarf to the Sun, Luhman 16AB (Luhman 2013). If preserved at the level predicted, there is a high probability that lithium can be detected in Hyades mid-L dwarfs. A determination of the lithium abundance in low-mass Hyades members would provide precise determinations of their masses and confirm them as genuine Hyades brown dwarfs.
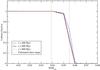 |
Fig. 8 Fraction of lithium as a function of mass for objects below 0.08 M⊙ at the age of the Hyades cluster (625 ± 50 Myr) using the AMES-Dusty model. We added the same curves for two bracketing ages of 400 Myr and 800 Myr. |
In Fig. 9 we compare our medium-resolution optical spectrum of 2M0418+21 smoothed by a factor of nine (black line) with the unsmoothed VLT X-shooter spectrum (red line) of Luhman16A (L7; R ~ 11 000; Lodieu et al. 2015). By direct comparison with the clear lithium absorption present in the X-shooter spectrum of Luhman 16A, we observe a wide feature around 6708 Å that might be consistent in strength with the full preservation of lithium. We measured an equivalent width in the range 15−20 Å. However, we cannot claim the detection of lithium due to the low signal-to-noise of the spectrum. If the absorption feature were confirmed as being due to lithium with a higher quality spectrum it would imply a mass below 0.050 M⊙. If true, 2M0418+21 would become the first relatively old L-type brown dwarf with well-determined mass and age. Its photometric and spectroscopic properties would represent a benchmark to classify isolated objects in the field for which neither mass nor age can be reliably determined.
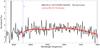 |
Fig. 9 GTC OSIRIS medium-resolution optical spectrum of 2M0415+21 binned by a factor of five (black line) compared to the smoothed (R ~ 730) VLT X-shooter spectrum (red line) of Luhman16A. The position of the lithium feature is indicated by a blue dashed vertical line. |
4.5. Alkali lines
We measured the pEWs of two alkali lines present in the spectra of mid-L dwarfs, which are known to be sensitive to gravity. They are better detected than the NaI doublet at ~8200 Å owing to the low signal-to-noise of our spectra and the redness of mid-L dwarfs. On the one hand, we measured consistent pEWs of 5 ± 2 Å for the RbI feature at 8946 Å in both low-resolution spectra. We checked the strength of this line in several L dwarfs with spectral types between L3 and L8 downloaded from Sandy Leggett’s homepage and in Luhman 16AB (Lodieu et al. 2015), yielding pEWs in the 3–7 Å range. On the other hand, we measured a pEW of 5.0 ± 0.5 Å for the CsI line at 8521 Å, consistent with the 3–6 Å range for L4–L6 dwarfs (see Figure 17 of Lodieu et al. 2015), obtained using data from Kirkpatrick et al. (2000) and Burgasser et al. (2003). The fits from Dupuy & Liu (2012) suggests MJ = 13.40 mag for a L5 dwarf with an rms of 0.39 mag. Our object would have MJ = 13.71 ± 0.07 mag, consistent with field dwarf within the uncertainties. At this spectral type (mid-L dwarfs), Fig. 25 of Liu et al. (2016) suggests that young objects have fainter absolute J-band magnitude, so our target is most consistent with the field population.
5. Conclusions
We cross-matched the 2MASS and AllWISE databases for identification of very low-mass stars and brown dwarfs with proper motions consistent with membership in the Hyades cluster. We report on the spectroscopic follow-up with GTC/OSIRIS of one faint proper motion candidate, 2M0418+21, discovered in this search. According to its photometry, proper motion/radial velocity, and spectroscopic properties we conclude that this object is very likely a brown dwarf member of the Hyades. The main results obtained from the astrometric, photometric, and spectroscopic analysis of the 2M0418+21 data are as follows:
-
a proper motion fully consistent with that of the Hyades cluster,where the maximum likelihood method suggests a probabilitygreater than 90% for membership in the Hyades;
-
an optical spectral type of L5.0 ± 0.5 fully consistent with the measured photometric colours;
-
a radial velocity of 38.0 ± 2.9 km s-1, which is combined with our proper motion to yield a space motion fully consistent with that of higher mass Hyades members;
-
a mean spectrophotometric distance of 48.8 ± 4.0 pc;
-
an mass estimated from evolutionary models and photometry between 0.039–0.055 M⊙, i.e. in the brown dwarf domain;
-
a spectrum consistent with lithium in absorption at 6707.8 Å; however, a higher signal-to-noise is required to confirm the full preservation of lithium expected for an object with mass below 0.050 M⊙;
-
strong Hα emission detected in the intermediate-resolution optical spectra obtained on 19 December 2015 leading to a Hα to bolometric luminosity ratio of −6.0 dex between the strongest mid-L emitters and the current upper limits set for old field L dwarfs.
Acknowledgments
This research has been supported by Project No. 15345/PI/10 from the Fundación Séneca and the Spanish Ministry of Economy and Competitiveness (MINECO) under the grants AYA2015-69350-C3-2-P and AYA2015-69350-C3-3-P.
This work is based on observations made with the Gran Telescopio Canarias (GTC), operated on the island of La Palma at the Spanish Observatorio del Roque de los Muchachos of the Instituto de Astrofísica de Canarias (programme GTC37-15A led by Pérez Garrido and programmes GTC51–14B and GTC38-15A led by Lodieu).
This research has made use of data from the UKIDSS project defined in Lawrence et al. (2007). UKIDSS uses the UKIRT Wide Field Camera (WFCAM; Casali et al. 2007). The photometric system is described in Hewett et al. (2006), and the calibration is described in Hodgkin et al. (2009). The pipeline processing and science archive are described in Irwin et al. (in prep.) and Hambly et al. (2008).
This publication makes use of data products from the Two Micron All Sky Survey (2MASS), which is a joint project of the University of Massachusetts and the Infrared Processing and Analysis Center/California Institute of Technology, funded by the National Aeronautics and Space Administration and the National Science Foundation. This publication makes use of data products from the Wide-field Infrared Survey Explorer, which is a joint project of the University of California, Los Angeles, and the Jet Propulsion Laboratory/California Institute of Technology, funded by the National Aeronautics and Space Administration.
Data from the Sloan Digital Sky Survey IV has been employed in the work. Funding for the Sloan Digital Sky Survey IV has been provided by the Alfred P. Sloan Foundation, the U.S. Department of Energy Office of Science, and the Participating Institutions. SDSS-IV acknowledges support and resources from the Center for High-Performance Computing at the University of Utah. The SDSS web site is www.sdss.org.
SDSS-IV is managed by the Astrophysical Research Consortium for the Participating Institutions of the SDSS Collaboration including the Brazilian Participation Group, the Carnegie Institution for Science, Carnegie Mellon University, the Chilean Participation Group, the French Participation Group, Harvard-Smithsonian Center for Astrophysics, Instituto de Astrofísica de Canarias, The Johns Hopkins University, Kavli Institute for the Physics and Mathematics of the Universe (IPMU)/University of Tokyo, Lawrence Berkeley National Laboratory, Leibniz Institut für Astrophysik Potsdam (AIP), Max-Planck-Institut für Astronomie (MPIA Heidelberg), Max-Planck-Institut für Astrophysik (MPA Garching), Max-Planck-Institut für Extraterrestrische Physik (MPE), National Astronomical Observatory of China, New Mexico State University, New York University, University of Notre Dame, Observatário Nacional/MCTI, The Ohio State University, Pennsylvania State University, Shanghai Astronomical Observatory, United Kingdom Participation Group, Universidad Nacional Autónoma de México, University of Arizona, University of Colorado Boulder, University of Oxford, University of Portsmouth, University of Utah, University of Virginia, University of Washington, University of Wisconsin, Vanderbilt University, and Yale University.
This publication makes use of data products from the Wide-field Infrared Survey Explorer, which is a joint project of the University of California, Los Angeles, and the Jet Propulsion Laboratory/California Institute of Technology, funded by the National Aeronautics and Space Administration.
This research has made use of the Simbad and Vizier databases, operated at the Centre de Données Astronomiques de Strasbourg (CDS), and of NASA’s Astrophysics Data System Bibliographic Services (ADS).
References
- Ahn, C. P., Alexandroff, R., Allen de Prieto, C., et al. 2012, ApJS, 203, 21 [NASA ADS] [CrossRef] [Google Scholar]
- Allard, F., Hauschildt, P. H., Alexander, D. R., Tamanai, A., & Schweitzer, A. 2001, ApJ, 556, 357 [NASA ADS] [CrossRef] [Google Scholar]
- Bannister, N. P., & Jameson, R. F. 2007, MNRAS, 378, L24 [NASA ADS] [Google Scholar]
- Baraffe, I., Chabrier, G., Allard, F., & Hauschildt, P. H. 1998, A&A, 337, 403 [NASA ADS] [Google Scholar]
- Baraffe, I., Homeier, D., Allard, F., & Chabrier, G. 2015, A&A, 577, A42 [NASA ADS] [CrossRef] [EDP Sciences] [Google Scholar]
- Bastian, N., Covey, K. R., & Meyer, M. R. 2010, ARA&A, 48, 339 [NASA ADS] [CrossRef] [Google Scholar]
- Berger, E., Basri, G., Fleming, T. A., et al. 2010, ApJ, 709, 332 [NASA ADS] [CrossRef] [Google Scholar]
- Boesgaard, A. M., & Friel, E. D. 1990, ApJ, 351, 467 [Google Scholar]
- Bouvier, J., Kendall, T., Meeus, G., et al. 2008, A&A, 481, 661 [NASA ADS] [CrossRef] [EDP Sciences] [Google Scholar]
- Bryja, C., Humphreys, R. M., & Jones, T. J. 1994, AJ, 107, 246 [NASA ADS] [CrossRef] [Google Scholar]
- Burgasser, A. J., Kirkpatrick, J. D., Liebert, J., & Burrows, A. 2003, ApJ, 594, 510 [NASA ADS] [CrossRef] [Google Scholar]
- Burgasser, A. J., Sitarski, B. N., Gelino, C. R., Logsdon, S. E., & Perrin, M. D. 2011, ApJ, 739, 49 [NASA ADS] [CrossRef] [Google Scholar]
- Burgasser, A. J., Melis, C., Zauderer, B. A., & Berger, E. 2013, ApJ, 762, L3 [NASA ADS] [CrossRef] [Google Scholar]
- Burgasser, A. J., Logsdon, S. E., Gagné, J., et al. 2015, ApJS, 220, 18 [NASA ADS] [CrossRef] [Google Scholar]
- Burrows, A., & Liebert, J. 1993, Rev. Mod. Phys., 65, 301 [NASA ADS] [CrossRef] [Google Scholar]
- Casali, M., Adamson, A., Alves de Oliveira, C., et al. 2007, A&A, 467, 777 [NASA ADS] [CrossRef] [EDP Sciences] [Google Scholar]
- Casewell, S. L., Jameson, R. F., & Burleigh, M. R. 2008, MNRAS, 390, 1517 [NASA ADS] [Google Scholar]
- Casewell, S. L., Littlefair, S. P., Burleigh, M. R., & Roy, M. 2014, MNRAS, 441, 2644 [NASA ADS] [CrossRef] [Google Scholar]
- Cepa, J., Aguiar, M., Escalera, V. G., et al. 2000, in Optical and IR Telescope Instrumentation and Detectors, eds. M. Iye, & A. F. Moorwood, Proc. SPIE, 4008, 623 [Google Scholar]
- Chabrier, G., & Baraffe, I. 1997, A&A, 327, 1039 [NASA ADS] [Google Scholar]
- Chabrier, G., Baraffe, I., Allard, F., & Hauschildt, P. 2000, ApJ, 542, 464 [NASA ADS] [CrossRef] [Google Scholar]
- Chiu, K., Fan, X., Leggett, S. K., et al. 2006, AJ, 131, 2722 [NASA ADS] [CrossRef] [Google Scholar]
- Cruz, K. L., Reid, I. N., Kirkpatrick, J. D., et al. 2007, AJ, 133, 439 [NASA ADS] [CrossRef] [Google Scholar]
- Cruz, K. L., Kirkpatrick, J. D., & Burgasser, A. J. 2009, AJ, 137, 3345 [NASA ADS] [CrossRef] [Google Scholar]
- Cutri, R. M., Skrutskie, M. F., van Dyk, S., et al. 2003, VizieR Online Data Catalog: II/246 [Google Scholar]
- Dahn, C. C., Harris, H. C., Vrba, F. J., et al. 2002, AJ, 124, 1170 [NASA ADS] [CrossRef] [Google Scholar]
- de Bruijne, J. H. J., Hoogerwerf, R., & de Zeeuw, P. T. 2001, A&A, 367, 111 [NASA ADS] [CrossRef] [EDP Sciences] [Google Scholar]
- Detweiler, H. L., Yoss, K. M., Radick, R. R., & Becker, S. A. 1984, AJ, 89, 1038 [NASA ADS] [CrossRef] [Google Scholar]
- Drilling, J. S., Jeffery, C. S., Heber, U., Moehler, S., & Napiwotzki, R. 2013, A&A, 551, A31 [NASA ADS] [CrossRef] [EDP Sciences] [Google Scholar]
- Dupuy, T. J., & Liu, M. C. 2012, ApJS, 201, 19 [NASA ADS] [CrossRef] [Google Scholar]
- Eggen, O. J. 1998, AJ, 116, 284 [NASA ADS] [CrossRef] [Google Scholar]
- EROS Collaboration, Goldman, B., Delfosse, X., et al. 1999, A&A, 351, L5 [NASA ADS] [Google Scholar]
- Faherty, J. K., Beletsky, Y., Burgasser, A. J., et al. 2014, ApJ, 790, 90 [NASA ADS] [CrossRef] [Google Scholar]
- Fan, X., Knapp, G. R., Strauss, M. A., et al. 2000, AJ, 119, 928 [NASA ADS] [CrossRef] [Google Scholar]
- Feiden, G. A., Jones, J., & Chaboyer, B. 2015, in Cambridge Workshop on Cool Stars, Stellar Systems, and the Sun, 18th Cambridge Workshop on Cool Stars, Stellar Systems, and the Sun, eds. G. T. van Belle, & H. C. Harris, 171 [Google Scholar]
- Gagné, J., Faherty, J. K., Cruz, K. L., et al. 2015, ApJS, 219, 33 [NASA ADS] [CrossRef] [Google Scholar]
- Geballe, T. R., Knapp, G. R., Leggett, S. K., et al. 2002, ApJ, 564, 466 [NASA ADS] [CrossRef] [Google Scholar]
- Gebran, M., Vick, M., Monier, R., & Fossati, L. 2010, A&A, 523, A71 [NASA ADS] [CrossRef] [EDP Sciences] [Google Scholar]
- Gizis, J. E. 2002, ApJ, 575, 484 [NASA ADS] [CrossRef] [Google Scholar]
- Goldman, B., Röser, S., Schilbach, E., et al. 2013, A&A, 559, A43 [NASA ADS] [CrossRef] [EDP Sciences] [Google Scholar]
- Golimowski, D. A., Leggett, S. K., Marley, M. S., et al. 2004, AJ, 127, 3516 [NASA ADS] [CrossRef] [Google Scholar]
- Hall, P. B. 2002a, ApJ, 580, L77 [NASA ADS] [CrossRef] [Google Scholar]
- Hambly, N. C., Collins, R. S., Cross, N. J. G., et al. 2008, MNRAS, 384, 637 [NASA ADS] [CrossRef] [Google Scholar]
- Harrington, R. S., & Dahn, C. C. 1980, AJ, 85, 454 [NASA ADS] [CrossRef] [Google Scholar]
- Henry, T. J., Jao, W.-C., Subasavage, J. P., et al. 2006, AJ, 132, 2360 [NASA ADS] [CrossRef] [Google Scholar]
- Hewett, P. C., Warren, S. J., Leggett, S. K., & Hodgkin, S. T. 2006, MNRAS, 367, 454 [NASA ADS] [CrossRef] [Google Scholar]
- Hodgkin, S. T., Irwin, M. J., Hewett, P. C., & Warren, S. J. 2009, MNRAS, 394, 675 [NASA ADS] [CrossRef] [Google Scholar]
- Høg, E., Fabricius, C., Makarov, V. V., et al. 2000, A&A, 355, L27 [NASA ADS] [Google Scholar]
- Hogan, E., Jameson, R. F., Casewell, S. L., Osbourne, S. L., & Hambly, N. C. 2008, MNRAS, 388, 495 [NASA ADS] [CrossRef] [Google Scholar]
- Kirkpatrick, J. D., Reid, I. N., Liebert, J., et al. 1999, ApJ, 519, 802 [NASA ADS] [CrossRef] [Google Scholar]
- Kirkpatrick, J. D., Reid, I. N., Liebert, J., et al. 2000, AJ, 120, 447 [NASA ADS] [CrossRef] [Google Scholar]
- Kirkpatrick, J. D., Dahn, C. C., Monet, D. G., et al. 2001, AJ, 121, 3235 [NASA ADS] [CrossRef] [Google Scholar]
- Kirkpatrick, J. D., Cruz, K. L., Barman, T. S., et al. 2008, ApJ, 689, 1295 [NASA ADS] [CrossRef] [Google Scholar]
- Knapp, G. R., Leggett, S. K., Fan, X., et al. 2004, AJ, 127, 3553 [NASA ADS] [CrossRef] [Google Scholar]
- Landolt, A. U., & Uomoto, A. K. 2007, AJ, 133, 768 [NASA ADS] [CrossRef] [Google Scholar]
- Lawrence, A., Warren, S. J., Almaini, O., et al. 2007, MNRAS, 379, 1599 [NASA ADS] [CrossRef] [MathSciNet] [Google Scholar]
- Leggett, S. K., Golimowski, D. A., Fan, X., et al. 2002, ApJ, 564, 452 [NASA ADS] [CrossRef] [Google Scholar]
- Lépine, S., & Shara, M. M. 2005, AJ, 129, 1483 [NASA ADS] [CrossRef] [Google Scholar]
- Liebert, J., Kirkpatrick, J. D., Cruz, K. L., et al. 2003, AJ, 125, 343 [NASA ADS] [CrossRef] [Google Scholar]
- Liu, M. C., Dupuy, T. J., & Allers, K. N. 2016, ApJ, 833, 96 [NASA ADS] [CrossRef] [Google Scholar]
- Lodieu, N., Hambly, N. C., Jameson, R. F., et al. 2007, MNRAS, 374, 372 [NASA ADS] [CrossRef] [Google Scholar]
- Lodieu, N., Boudreault, S., & Béjar, V. J. S. 2014, MNRAS, 445, 3908 [NASA ADS] [CrossRef] [Google Scholar]
- Lodieu, N., Zapatero Osorio, M. R., Rebolo, R., et al. 2015, A&A, 581, A73 [NASA ADS] [CrossRef] [EDP Sciences] [Google Scholar]
- Lucas, P. W., Hoare, M. G., Longmore, A., et al. 2008, MNRAS, 391, 136 [NASA ADS] [CrossRef] [Google Scholar]
- Luhman, K. L. 2012, ARA&A, 50, 65 [NASA ADS] [CrossRef] [Google Scholar]
- Luhman, K. L. 2013, ApJ, 767, L1 [NASA ADS] [CrossRef] [Google Scholar]
- Madsen, S., Dravins, D., & Lindegren, L. 2002, A&A, 381, 446 [NASA ADS] [CrossRef] [EDP Sciences] [Google Scholar]
- Magazzu, A., Martin, E. L., & Rebolo, R. 1993, ApJ, 404, L17 [NASA ADS] [CrossRef] [Google Scholar]
- Mermilliod, J. C. 1981, A&A, 97, 235 [NASA ADS] [Google Scholar]
- Monet, D. G., Levine, S. E., Canzian, B., et al. 2003, AJ, 125, 984 [NASA ADS] [CrossRef] [Google Scholar]
- Perryman, M. A. C., Brown, A. G. A., Lebreton, Y., et al. 1998, A&A, 331, 81 [NASA ADS] [Google Scholar]
- Pineda, J. S., Hallinan, G., Kirkpatrick, J. D., et al. 2016, ApJ, 826, 73 [NASA ADS] [CrossRef] [Google Scholar]
- Rebolo, R., Martin, E. L., & Magazzu, A. 1992, ApJ, 389, L83 [NASA ADS] [CrossRef] [Google Scholar]
- Reid, I. N., Kirkpatrick, J. D., Gizis, J. E., et al. 2000, AJ, 119, 369 [NASA ADS] [CrossRef] [Google Scholar]
- Reiners, A., & Basri, G. 2008, ApJ, 684, 1390 [NASA ADS] [CrossRef] [Google Scholar]
- Sanders, W. L. 1971, A&A, 14, 226 [NASA ADS] [Google Scholar]
- Schmidt, S. J., Cruz, K. L., Bongiorno, B. J., Liebert, J., & Reid, I. N. 2007, AJ, 133, 2258 [NASA ADS] [CrossRef] [Google Scholar]
- Schmidt, S. J., West, A. A., Hawley, S. L., & Pineda, J. S. 2010, AJ, 139, 1808 [NASA ADS] [CrossRef] [Google Scholar]
- Schmidt, S. J., West, A. A., Bochanski, J. J., Hawley, S. L., & Kielty, C. 2014, PASP, 126, 642 [NASA ADS] [Google Scholar]
- Schmidt, S. J., Hawley, S. L., West, A. A., et al. 2015, AJ, 149, 158 [NASA ADS] [CrossRef] [Google Scholar]
- Siess, L., Dufour, E., & Forestini, M. 2000, A&A, 358, 593 [Google Scholar]
- Sion, E. M., Holberg, J. B., Oswalt, T. D., McCook, G. P., & Wasatonic, R. 2009, AJ, 138, 1681 [NASA ADS] [CrossRef] [Google Scholar]
- Skrutskie, M. F., Cutri, R. M., Stiening, R., et al. 2006, AJ, 131, 1163 [NASA ADS] [CrossRef] [Google Scholar]
- Smart, R. L., & Nicastro, L. 2014, A&A, 570, A87 [NASA ADS] [CrossRef] [EDP Sciences] [Google Scholar]
- Tody, D. 1986, in Instrumentation in astronomy VI, ed. D. L. Crawford, Proc. SPIE, 627, 733 [Google Scholar]
- Tody, D. 1993, in Astronomical Data Analysis Software and Systems II, eds. R. J. Hanisch, R. J. V. Brissenden, & J. Barnes, ASP Conf. Ser., 52, 173 [Google Scholar]
- van Leeuwen, F. 2007, A&A, 474, 653 [NASA ADS] [CrossRef] [EDP Sciences] [Google Scholar]
- van Leeuwen, F. 2009, A&A, 497, 209 [NASA ADS] [CrossRef] [EDP Sciences] [Google Scholar]
- Vrba, F. J., Henden, A. A., Luginbuhl, C. B., et al. 2004, AJ, 127, 2948 [NASA ADS] [CrossRef] [Google Scholar]
- Wright, E. L., Eisenhardt, P. R. M., Mainzer, A. K., et al. 2010, AJ, 140, 1868 [NASA ADS] [CrossRef] [Google Scholar]
- York, D. G., Adelman, J., Anderson, Jr., J. E., et al. 2000, AJ, 120, 1579 [Google Scholar]
- Zapatero Osorio, M. R., Lane, B. F., Pavlenko, Y., et al. 2004, ApJ, 615, 958 [NASA ADS] [CrossRef] [Google Scholar]
- Zapatero Osorio, M. R., Béjar, V. J. S., Miles-Páez, P. A., et al. 2014, A&A, 568, A6 [NASA ADS] [CrossRef] [EDP Sciences] [Google Scholar]
All Tables
All Figures
|
Fig. 1 Proper motion diagram of the Hyades cluster. Green triangles correspond to Hyades members (Goldman et al. 2013) and the solid square corresponds to 2M0418+21. Black dots corresponds to objects in the Simbad database within a circular radius of 2 degrees around 2M0418+21. |
| In the text | |
|
Fig. 2 Finding chart of 2M0418+21 in J band from UKIDSS Galactic Cluster Survey. |
| In the text | |
|
Fig. 3 J−K, W1−W2, and J−W2 colour as a function of mass from the AMES-Dusty evolutionary model. The dashed red line with the bottom and top red line represent the W1−W2 (AllWISE) and J−K (UKIDSS) colours of 2M0418+21 with their error bars. |
| In the text | |
|
Fig. 4 (W1−W2, MW2) colour-magnitude diagram depicting known L dwarfs in the Hyades (red squares; Hogan et al. 2008; Casewell et al. 2014; Lodieu et al. 2014), Hyades high-mass and low-mass members (black dots; Goldman et al. 2013), the mean sequence of field L and T dwarfs shifted to 46.3 pc (purple line; Dupuy & Liu 2012), and our target 2M0418+21 (solid square; this work). |
| In the text | |
|
Fig. 5 Left: (J−H2, J) colour-magnitude for all point sources within 5 arcmin of 2M0418+21 highlighted by a large red dot. Middle: same but for (H−H2, H). Right: same but for (K−H2, K). Hyades members from Goldman et al. (2013) and field L/T dwarfs with H2 photometry from the UKIDSS GPS are plotted as red and blue open squares, respectively. |
| In the text | |
|
Fig. 6 Low-resolution optical spectra of 2M0418 obtained with the R300R (three spectra) and R1000R (third from bottom) gratings on GTC/OSIRIS (black lines). The continuum of the spectra are offset vertically by 1.5 for visualization purposes. From top to bottom: we overplotted the spectra of 2MASS J00361617+1821104 (L4; green), the Sloan dwarf template (L5; red), the spectrum of SDSS J053952−005902 (L5; red), and 2MASS J08251968+2115521 (L6; green). See text for details. |
| In the text | |
|
Fig. 7 Bottom: combined 1D optical spectrum of 2M0418+21 taken with the R2500R grating on GTC/OSIRIS on 19 December 2015. No smoothing was applied. Top: final combined 2D image of the R2500R spectrum of 2M0418+21. The white dot on the left-hand side corresponds to the Hα emission. The faint continuum is barely seen, but is present. |
| In the text | |
|
Fig. 8 Fraction of lithium as a function of mass for objects below 0.08 M⊙ at the age of the Hyades cluster (625 ± 50 Myr) using the AMES-Dusty model. We added the same curves for two bracketing ages of 400 Myr and 800 Myr. |
| In the text | |
|
Fig. 9 GTC OSIRIS medium-resolution optical spectrum of 2M0415+21 binned by a factor of five (black line) compared to the smoothed (R ~ 730) VLT X-shooter spectrum (red line) of Luhman16A. The position of the lithium feature is indicated by a blue dashed vertical line. |
| In the text | |
Current usage metrics show cumulative count of Article Views (full-text article views including HTML views, PDF and ePub downloads, according to the available data) and Abstracts Views on Vision4Press platform.
Data correspond to usage on the plateform after 2015. The current usage metrics is available 48-96 hours after online publication and is updated daily on week days.
Initial download of the metrics may take a while.