Fig. 6
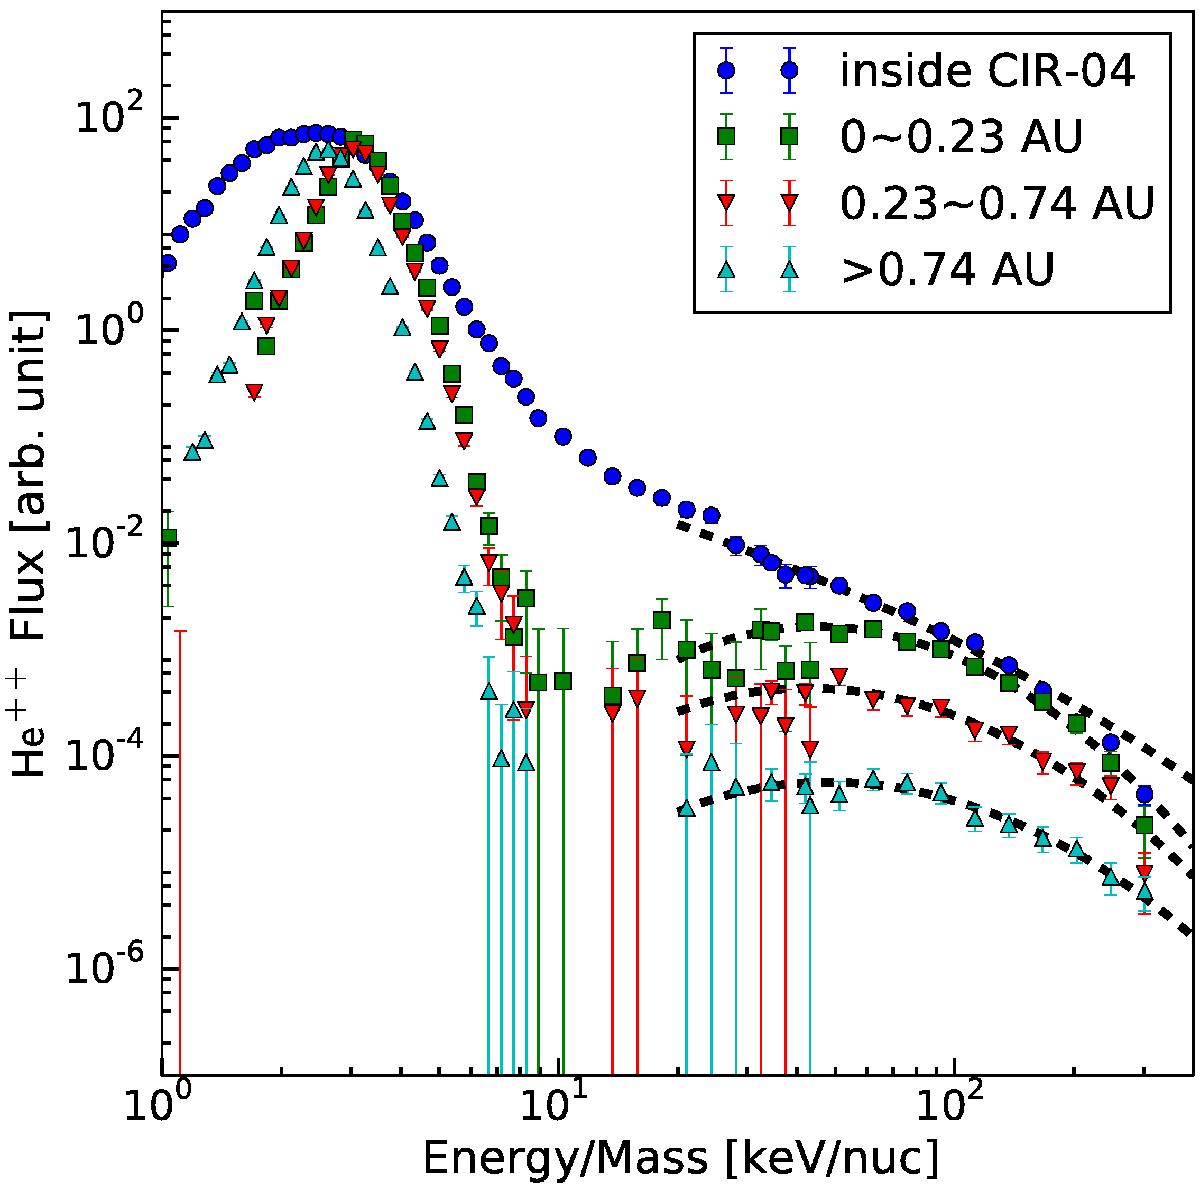
Energy spectrum of He++ in the F′ region of CIR 04 is shown with blue dots. The temporal evolution of three spectra in the F region are illustrated with green rectangles and red and cyan triangles. The fitted dashed curves through the observed points are based on the theory of Fisk & Lee (1980). The turnover shape of the spectra is clearly visible in the fast-wind region of CIR 04.
Current usage metrics show cumulative count of Article Views (full-text article views including HTML views, PDF and ePub downloads, according to the available data) and Abstracts Views on Vision4Press platform.
Data correspond to usage on the plateform after 2015. The current usage metrics is available 48-96 hours after online publication and is updated daily on week days.
Initial download of the metrics may take a while.