Fig. 1
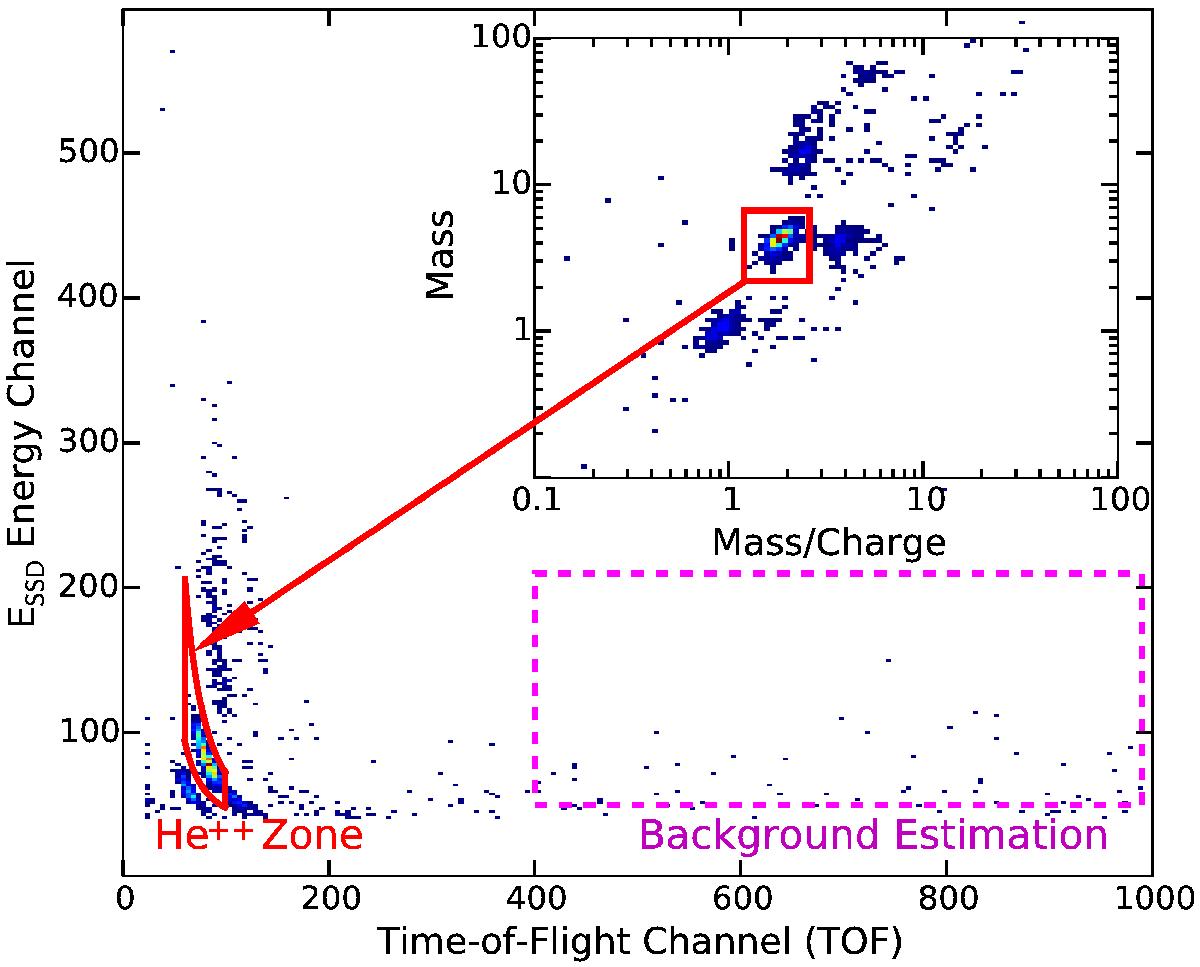
STOF data acquired for the range of 60−84 E/q steps during days 206−211 in 2003. The panel shows the measured energy, ESSD vs. TOF, while its inset shows the same data mapped to m-m/q space. Alpha particles are surrounded by a red square in the inset. The corresponding ESSD-TOF measurements are surrounded by a mapped closed red curve that corresponds to the red rectangle in m-m/q space. The accidental coincidence events (or instrumental background) are uniformly distributed throughout the entire TOF region and fall randomly within the real ion zone, e.g., He++. The large dashed magenta rectangle in the high-TOF region is used to estimate the background level of our measurements.
Current usage metrics show cumulative count of Article Views (full-text article views including HTML views, PDF and ePub downloads, according to the available data) and Abstracts Views on Vision4Press platform.
Data correspond to usage on the plateform after 2015. The current usage metrics is available 48-96 hours after online publication and is updated daily on week days.
Initial download of the metrics may take a while.