Fig. 7
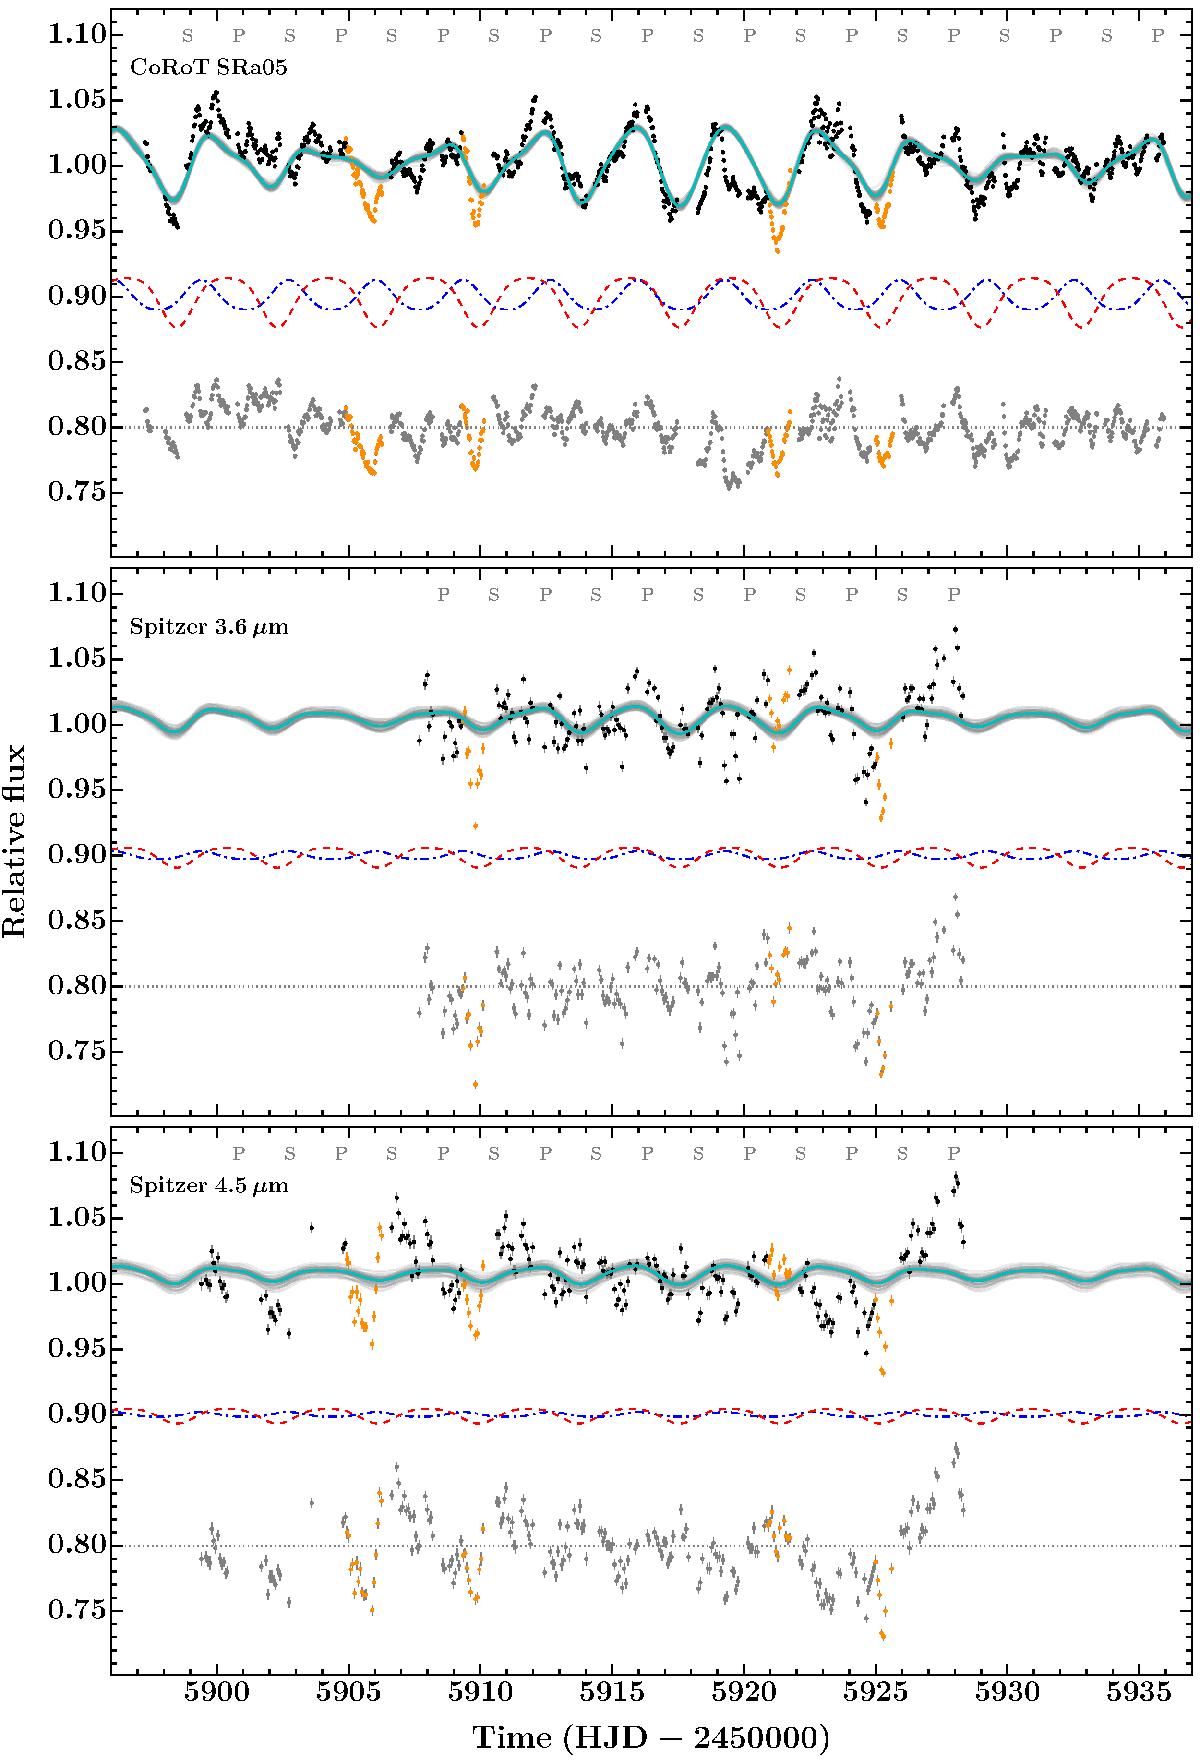
Top: out-of-eclipse 2011/2012 CoRoT light curve (black) with the two-spot model (cyan) and individual light curve draws from the converged MCMC walkers (grey). Data masked in in the fit are shown by orange points. Vertically offset are the individual spot models for the primary and secondary stars (red dashed and blue dot-dashed, respectively) and the residuals (grey). Middle and bottom: as above for Spitzer 3.6 and 4.5 μm, respectively. All plots share common axes.
Current usage metrics show cumulative count of Article Views (full-text article views including HTML views, PDF and ePub downloads, according to the available data) and Abstracts Views on Vision4Press platform.
Data correspond to usage on the plateform after 2015. The current usage metrics is available 48-96 hours after online publication and is updated daily on week days.
Initial download of the metrics may take a while.