Fig. 4
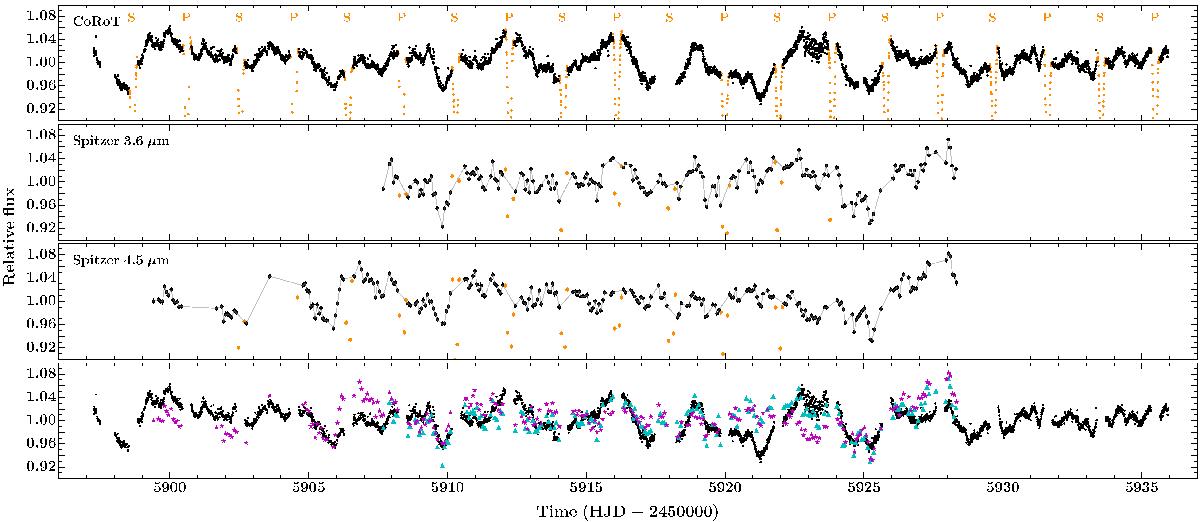
CoRoT and Spitzer light curves from the CSI 2264 campaign. Top three plots: optical CoRoT, IR Spitzer 3.6 μm and Spitzer 4.5 μm light curves. The out-of-eclipse data is shown in black and the stellar eclipses in orange (P and S indicate primary and secondary eclipses, respectively). To help guide the eye, grey lines join the out-of-eclipse data in the Spitzer bands. Bottom: CoRoT, 3.6 and 4.5 μm out-of-eclipse light curves (without errors) over-plotted (black points, cyan triangles and magenta stars, respectively). All plots share common axes.
Current usage metrics show cumulative count of Article Views (full-text article views including HTML views, PDF and ePub downloads, according to the available data) and Abstracts Views on Vision4Press platform.
Data correspond to usage on the plateform after 2015. The current usage metrics is available 48-96 hours after online publication and is updated daily on week days.
Initial download of the metrics may take a while.