Fig. 13
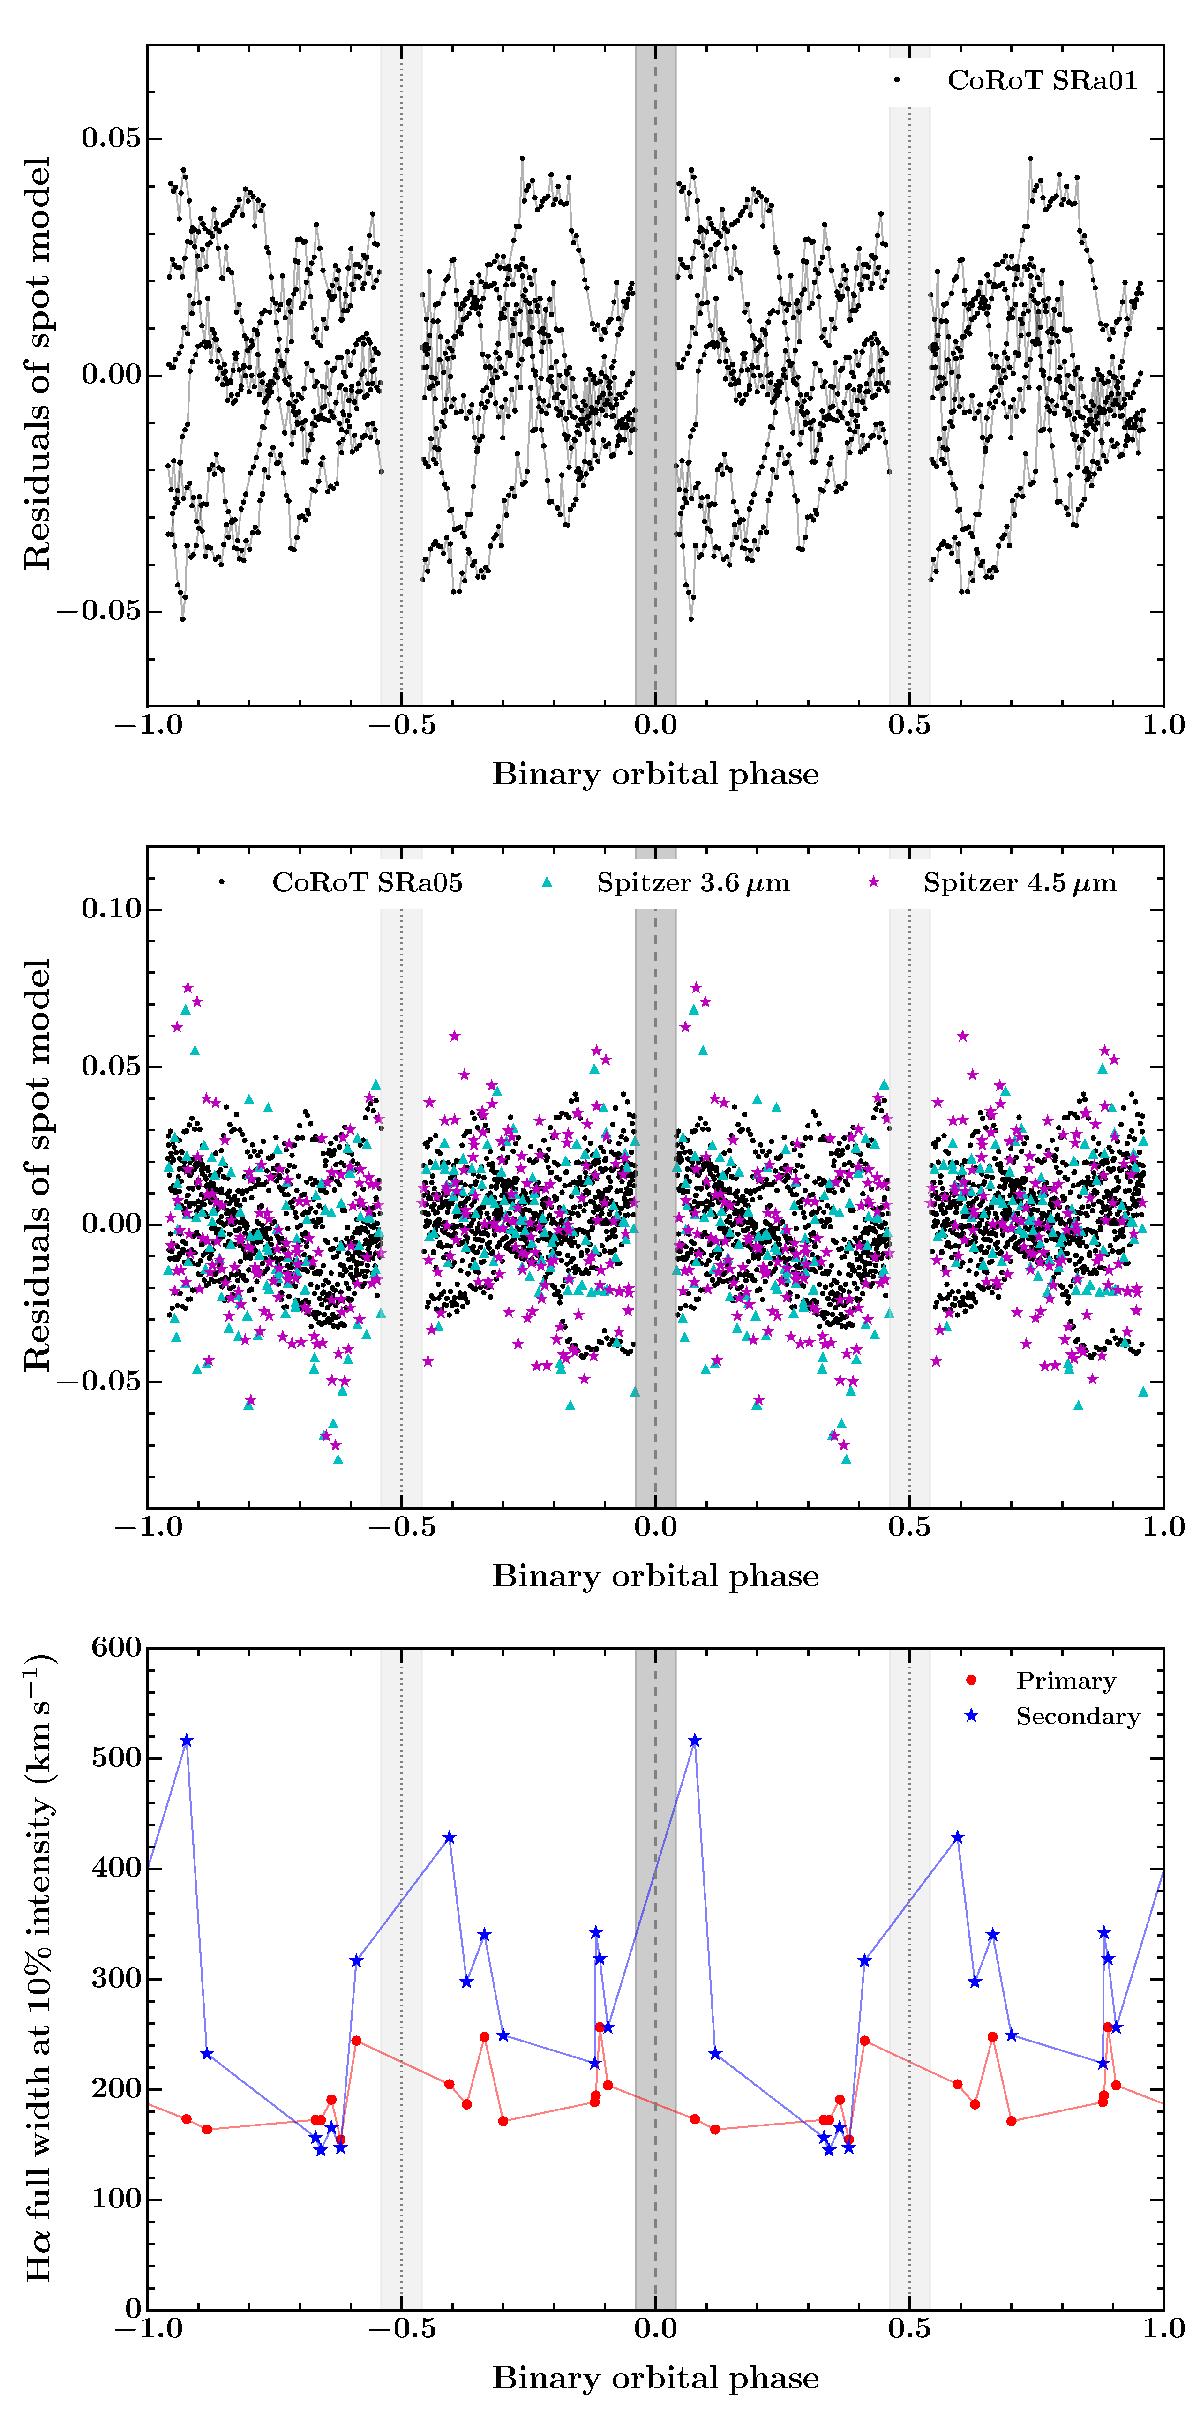
Correlation between binary orbital phase and the spot-corrected photometric, and spectroscopic Hα, variations. Top: residuals of the 2008 spot model folded at the binary orbital period. The dark and light vertical grey bands around phases 0.0 and ±0.5 indicate the phase and duration of primary and secondary eclipses, respectively. Middle: same as top but for the 2011/2012 CoRoT and Spitzer residuals (black points, CoRoT; cyan triangles, Spitzer 3.6 μm; and magenta stars, Spitzer 4.5 μm). Bottom: full width at 10% intensity of the primary and secondary Hα emission components folded at the binary orbital period (red points and blue stars, respectively).
Current usage metrics show cumulative count of Article Views (full-text article views including HTML views, PDF and ePub downloads, according to the available data) and Abstracts Views on Vision4Press platform.
Data correspond to usage on the plateform after 2015. The current usage metrics is available 48-96 hours after online publication and is updated daily on week days.
Initial download of the metrics may take a while.