Fig. 11
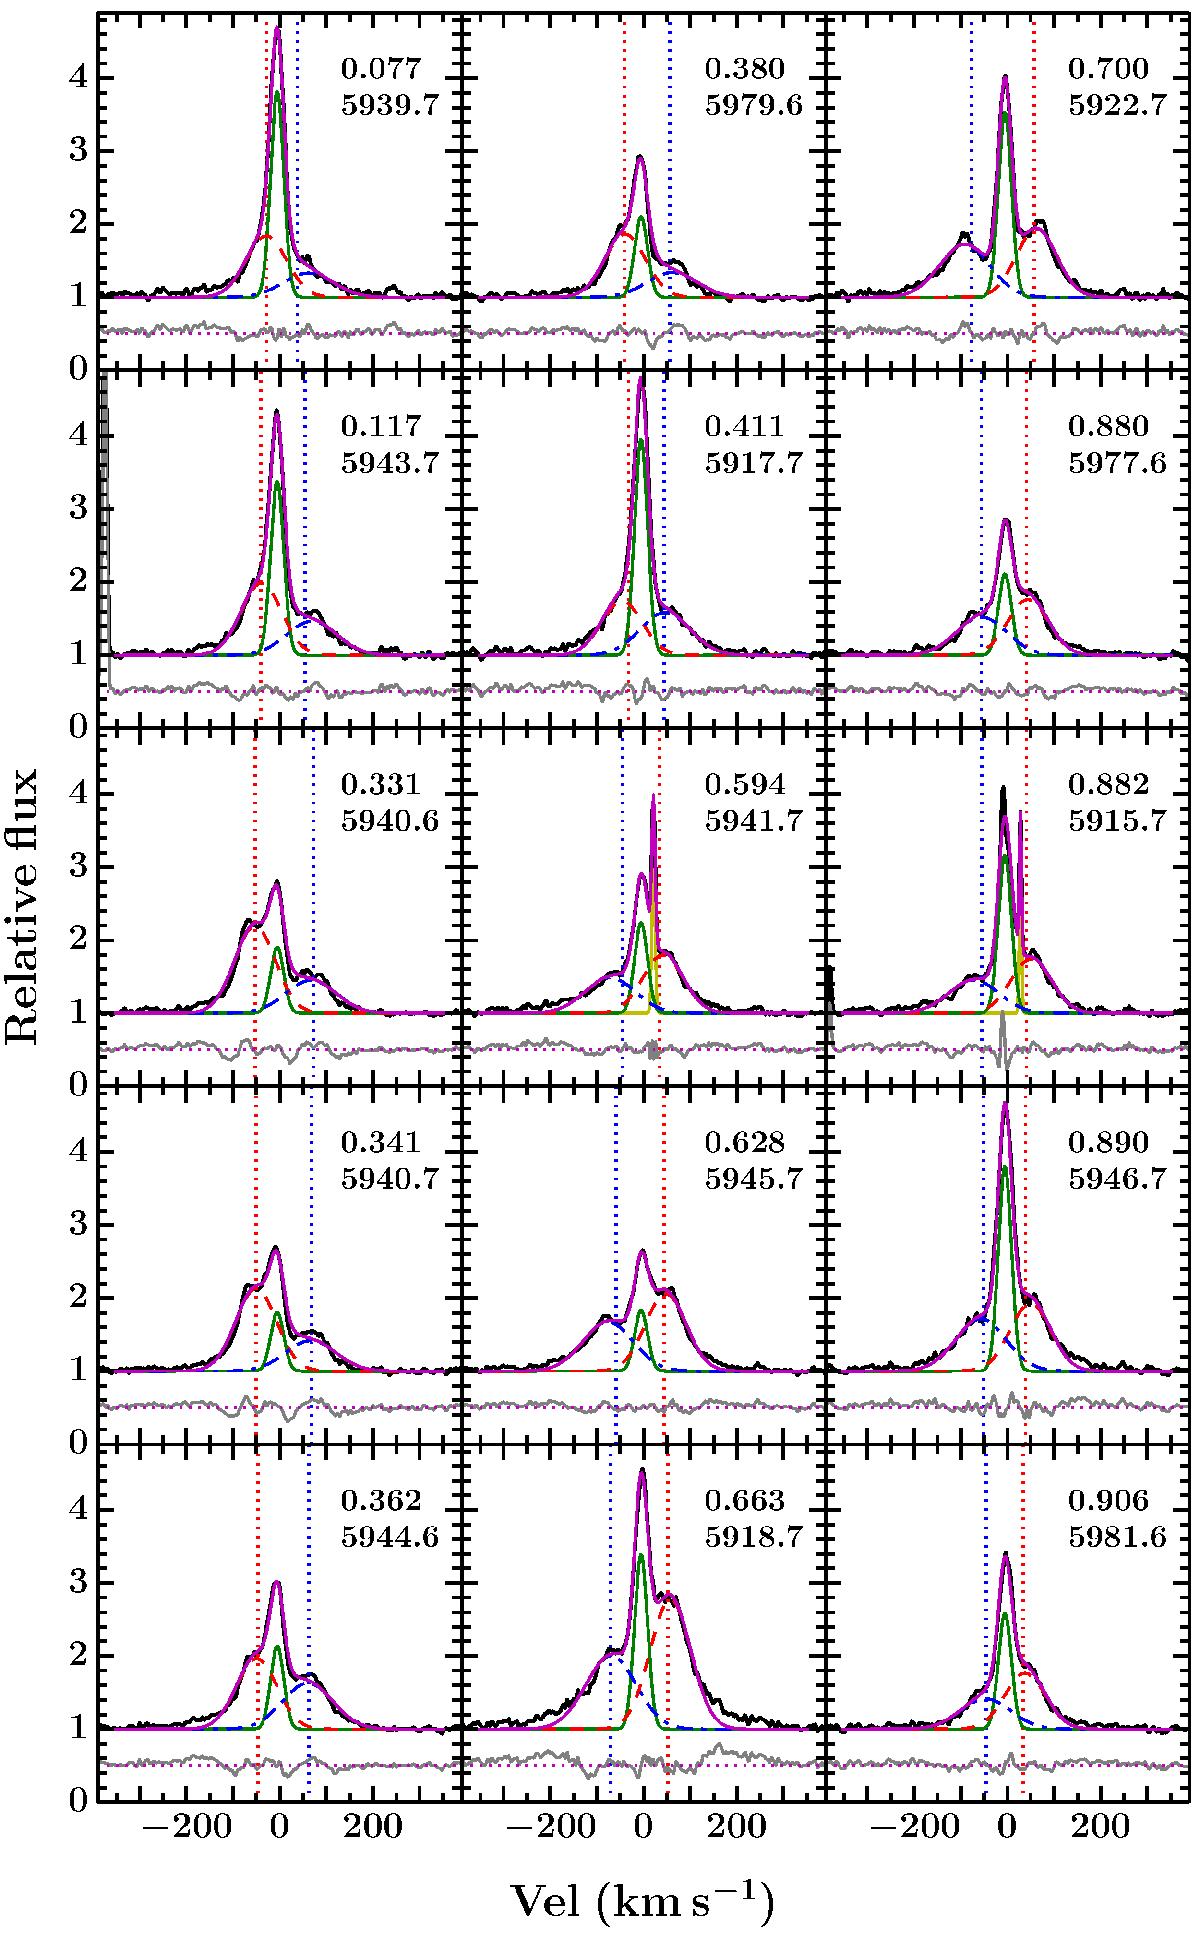
15 VLT/FLAMES Hα profiles ordered in phase throughout the binary orbit (phase and rHJD indicated in each subplot). The spectra (black) are modelled as the sum of three Gaussians (magenta). In each case, the central, narrow, static Gaussian (green) is nebula emission and the varying red dashed and blue dot-dashed Gaussians correspond to emission associated with the primary and secondary stars, respectively. The vertical dotted red and blue lines indicate the radial velocities of the primary and secondary stars respectively, at the time of observation. Vertically offset below are the residuals of the model in grey. In two profiles, phases 0.594 and 0.882, additional Gaussians (yellow) are present to account for spikes, which we attribute to cosmic rays.
Current usage metrics show cumulative count of Article Views (full-text article views including HTML views, PDF and ePub downloads, according to the available data) and Abstracts Views on Vision4Press platform.
Data correspond to usage on the plateform after 2015. The current usage metrics is available 48-96 hours after online publication and is updated daily on week days.
Initial download of the metrics may take a while.