Fig. 10
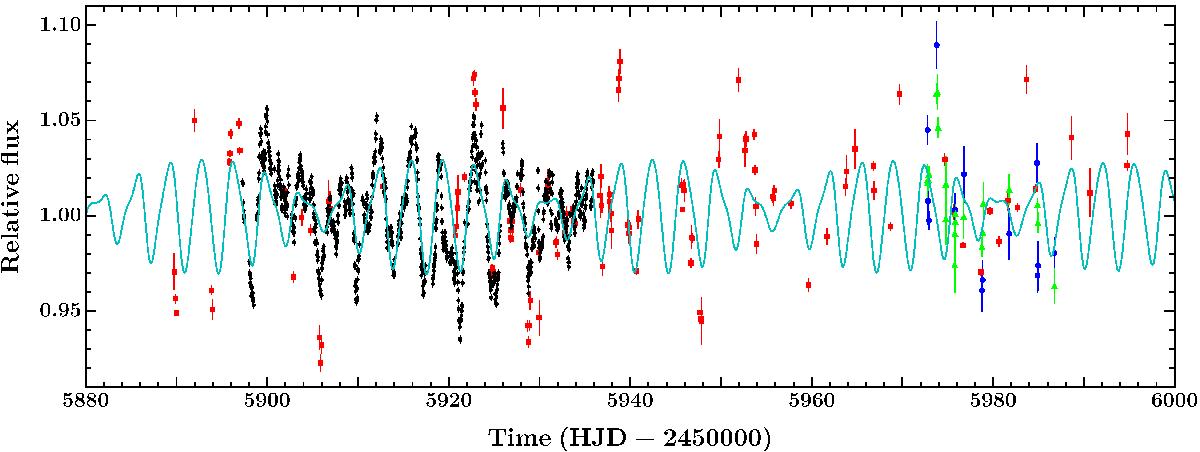
Out-of-eclipse light curves from CoRoT (2011/2012 run), USNO and CFHT (u and r-band) spanning 120 days (black points, red squares, blue circles and green triangles, respectively). For clarity, the Spitzer light curves are not shown. Our two-spot model, derived from fitting the simultaneous 2011/2012 CoRoT and Sptizer light curves, is shown in cyan and extended across the entire period of observations. For clarity, we only show USNO and CFHT data with uncertainties less than 0.015.
Current usage metrics show cumulative count of Article Views (full-text article views including HTML views, PDF and ePub downloads, according to the available data) and Abstracts Views on Vision4Press platform.
Data correspond to usage on the plateform after 2015. The current usage metrics is available 48-96 hours after online publication and is updated daily on week days.
Initial download of the metrics may take a while.