Fig. 1
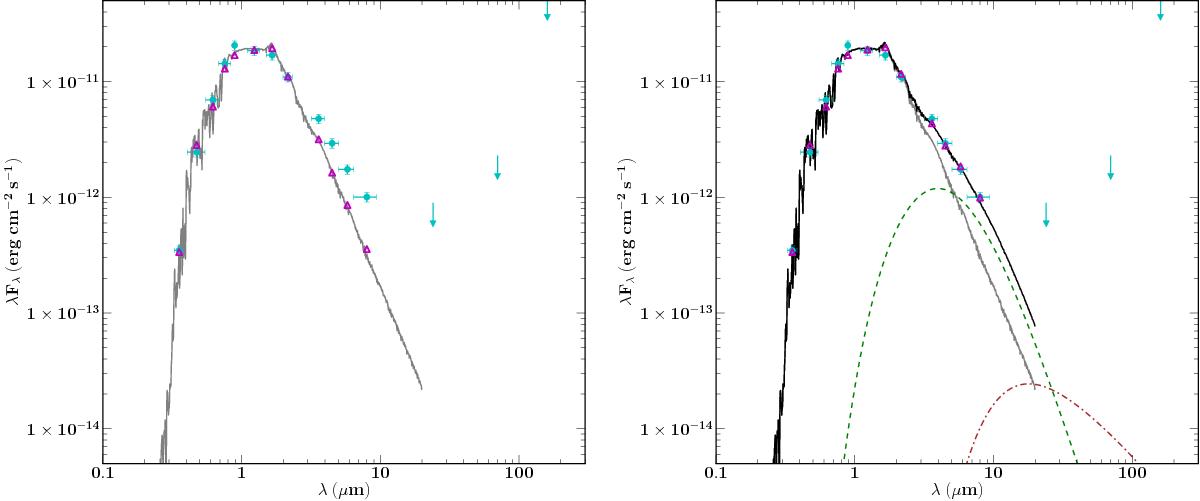
Spectral energy distribution of CoRoT 223992193 (cyan points) with upper limits in the far-infrared (cyan arrows). This figure is identical to Fig. 13 of Gillen et al. (2014, Paper I); it is reproduced here for clarity. Left: the grey line and magenta triangles show the best-fit model using two naked stellar photospheres. Right: the black line and magenta triangles show the best-fit two naked photospheres model with a small amount of hot dust in the inner cavity of the circumbinary disk. The stellar and hot dust terms are shown separately as the grey solid and dashed green lines, respectively. Also shown for completeness, but not used in the fit, is the expected emission from a razor-thin circumbinary disk extending down to 22 R⊙ (brown dot-dashed line), which is illuminated by the central star and heated by the gravitational potential energy released from accretion with Ṁ = 10-11M⊙ yr-1.
Current usage metrics show cumulative count of Article Views (full-text article views including HTML views, PDF and ePub downloads, according to the available data) and Abstracts Views on Vision4Press platform.
Data correspond to usage on the plateform after 2015. The current usage metrics is available 48-96 hours after online publication and is updated daily on week days.
Initial download of the metrics may take a while.