Fig. 10
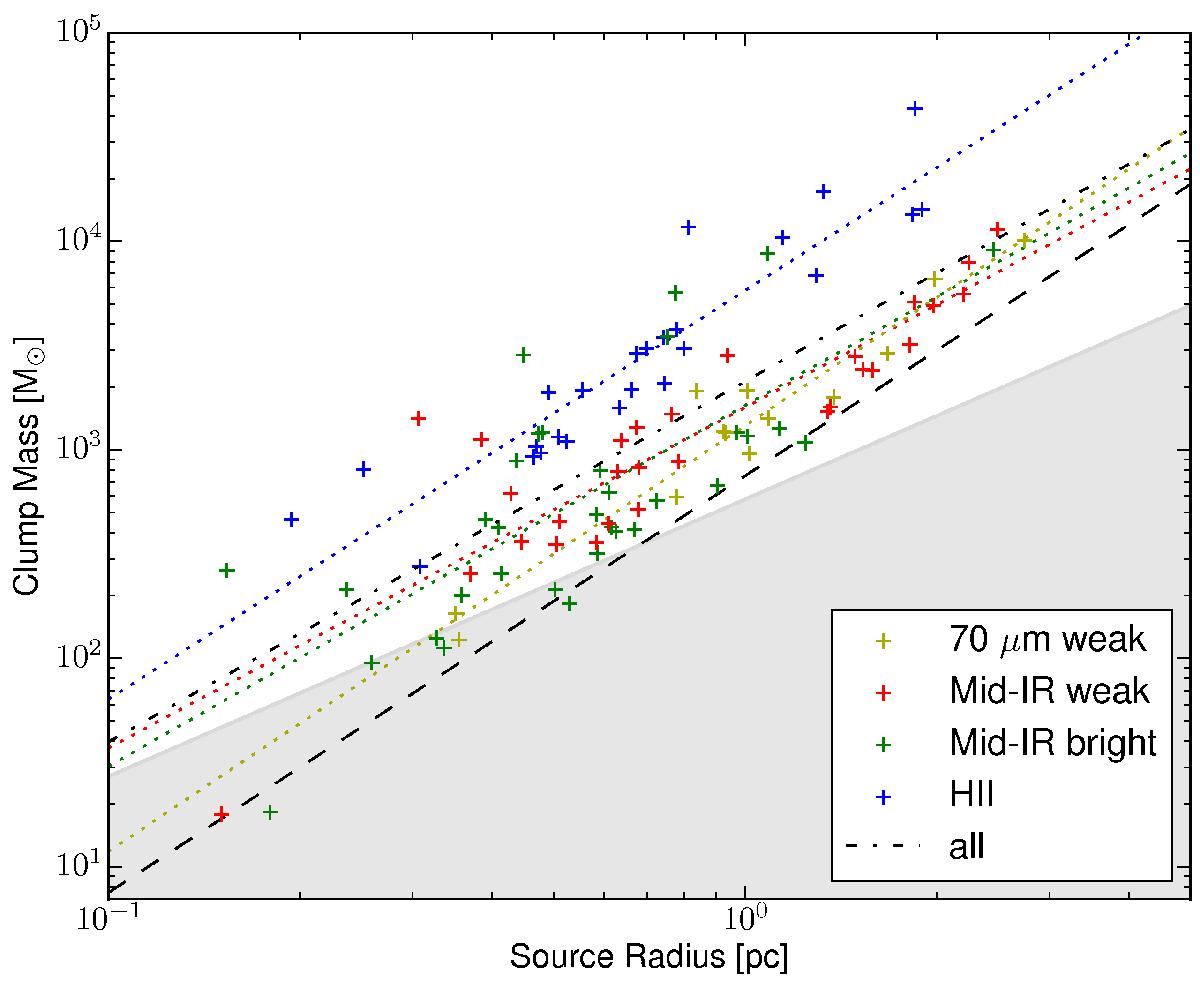
Mass-size relationship of the ATLASGAL Top100. The lower right gray shaded area highlights the region where it is unlikely that high-mass stars are formed according to Kauffmann et al. (2010) and the black dashed line indicates a surface density of 0.05 g cm-2 determined as the lower limit for efficient massive-star formation by Urquhart et al. (2014c). The slopes of the linear log-log fits of all classes agree with each other within the margin of error of the fitted power laws.
Current usage metrics show cumulative count of Article Views (full-text article views including HTML views, PDF and ePub downloads, according to the available data) and Abstracts Views on Vision4Press platform.
Data correspond to usage on the plateform after 2015. The current usage metrics is available 48-96 hours after online publication and is updated daily on week days.
Initial download of the metrics may take a while.