Fig. 5
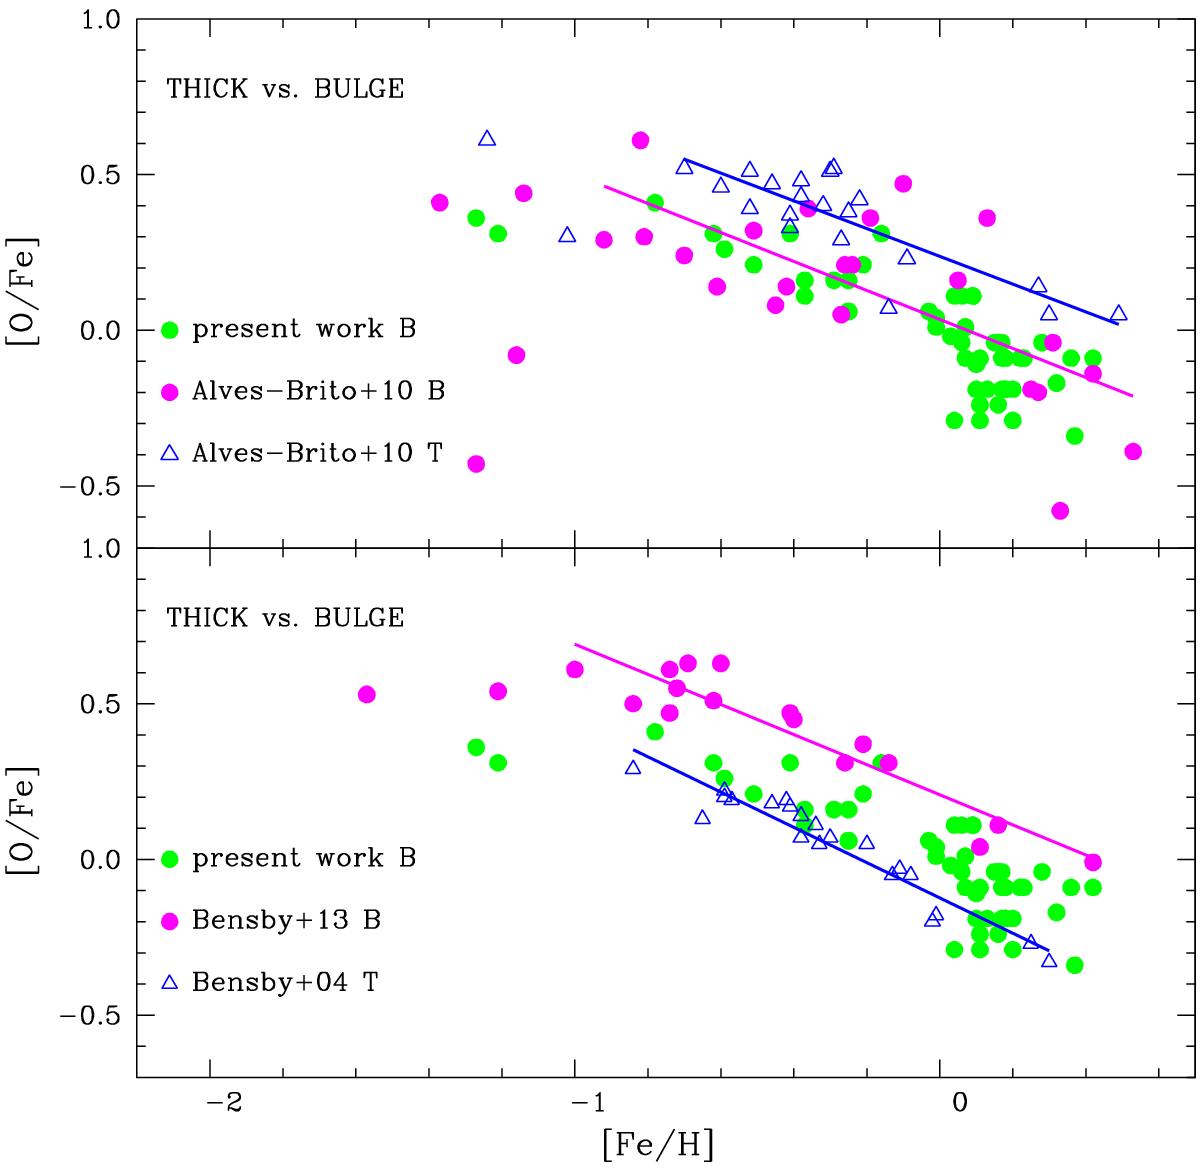
[O/Fe] vs. [Fe/H]: present results for bulge giants compared to: a) thick disk and bulge giants. The lines are the linear regressions to the data with [Fe/H] ≥ −1.0; the upper blue line is the linear regression to the thick disk data and the lower magenta line is the linear regression to the bulge data. by Alves-Brito et al. (2010); b) thick disk and bulge dwarfs by Bensby et al. (2004, 2013). The upper magenta line is the linear regression to the bulge data and the lower blue line is the linear regression to the thick disk data.
Current usage metrics show cumulative count of Article Views (full-text article views including HTML views, PDF and ePub downloads, according to the available data) and Abstracts Views on Vision4Press platform.
Data correspond to usage on the plateform after 2015. The current usage metrics is available 48-96 hours after online publication and is updated daily on week days.
Initial download of the metrics may take a while.