Fig. 3
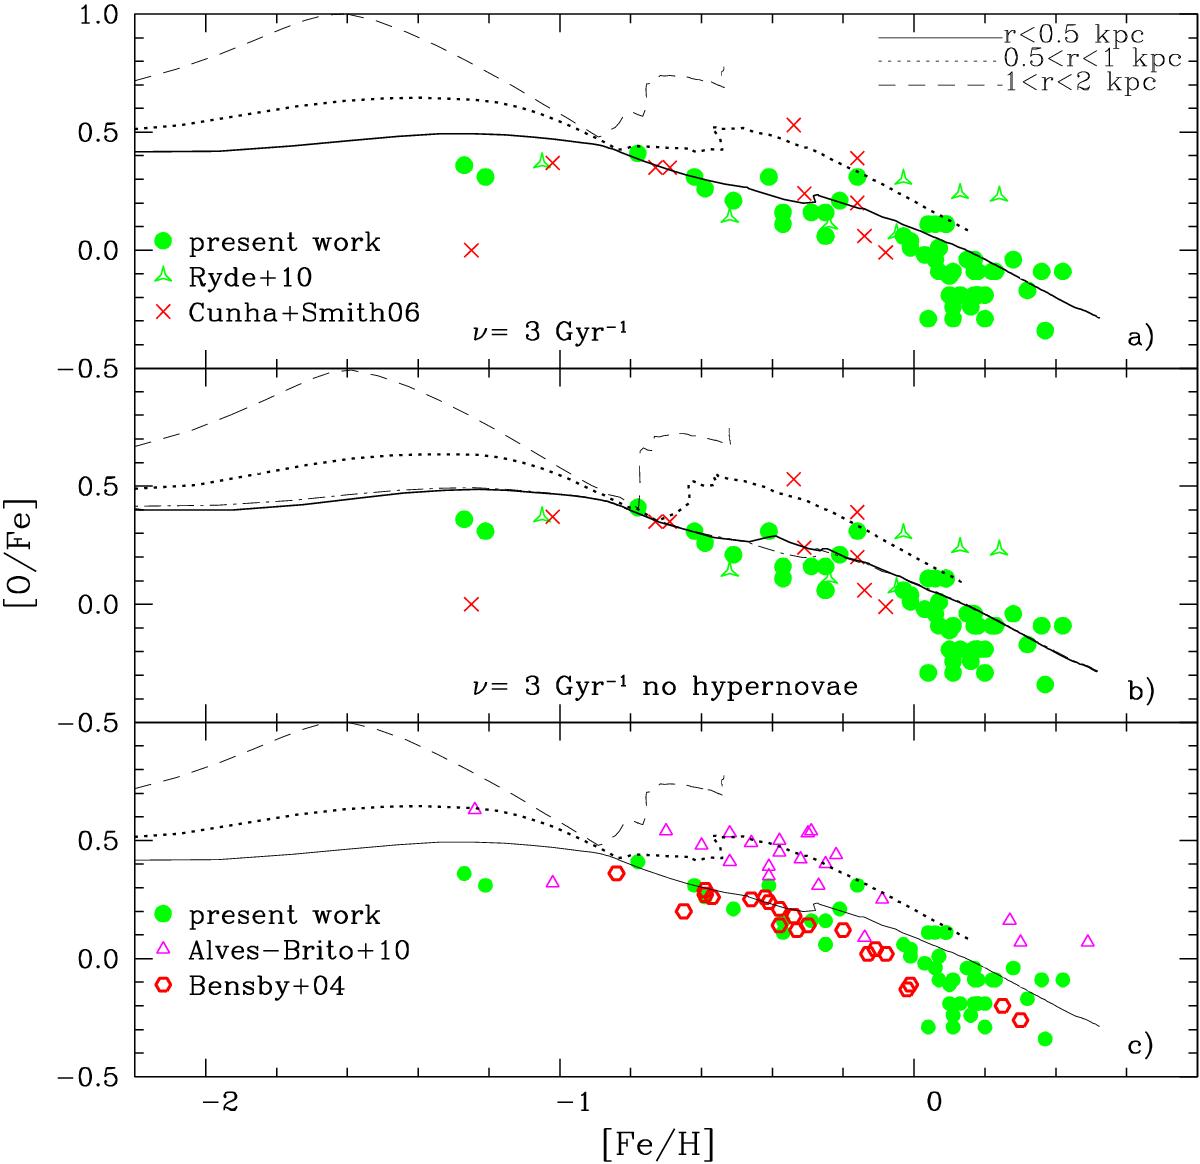
[O/Fe] vs. [Fe/H] for the present results together with literature abundances for and bulge and thick disk stars and the predictions of the chemodynamical model for the bulge. Panel a): the data derived for the sample bulge giant stars are compared with the results for bulge giants from Cunha & Smith (2006) and Ryde et al. (2010). The lines are the predictions of the model assumig a specific star formation rate of νSF = 3 Gyr-1. Panel b): same data as in panel a) and the predicted O/Fe] vs. [Fe/H] for the model with no hypernovae. The dot-dashed line is the prediction by the model with hypernovae for r< 0.5 kpc; panel c): the [O/Fe] vs. [Fe/H] of the thick disk dwarfs from Bensby et al. (2004), thick disk giants from Alves-Brito et al. (2010) are superposed on the model predictions of panel a).
Current usage metrics show cumulative count of Article Views (full-text article views including HTML views, PDF and ePub downloads, according to the available data) and Abstracts Views on Vision4Press platform.
Data correspond to usage on the plateform after 2015. The current usage metrics is available 48-96 hours after online publication and is updated daily on week days.
Initial download of the metrics may take a while.