Free Access
Fig. 8
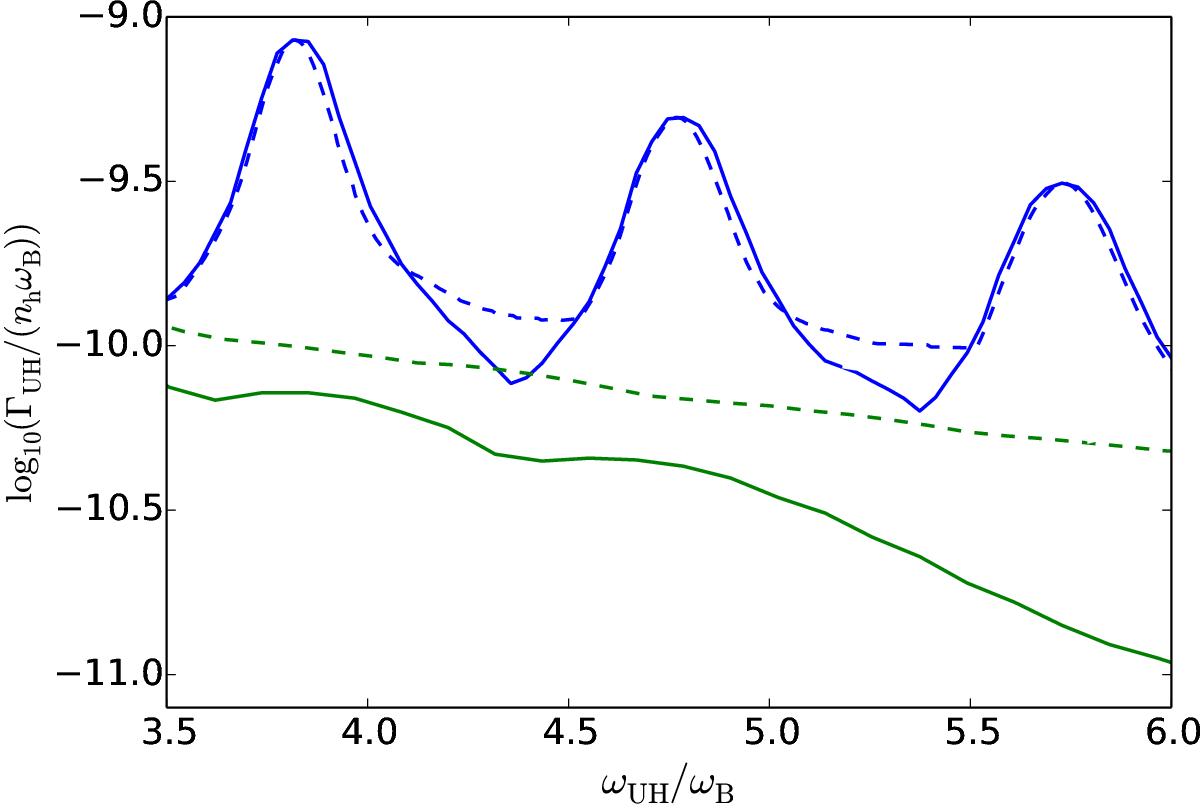
Comparison of the growth rates with summation over s and for s with the maximal growth rate, for Model 1 (blue line) and Model 5 (green line). Dashed lines show summation over s and solid lines correspond to s with the maximal growth rate.
Current usage metrics show cumulative count of Article Views (full-text article views including HTML views, PDF and ePub downloads, according to the available data) and Abstracts Views on Vision4Press platform.
Data correspond to usage on the plateform after 2015. The current usage metrics is available 48-96 hours after online publication and is updated daily on week days.
Initial download of the metrics may take a while.