Fig. 8
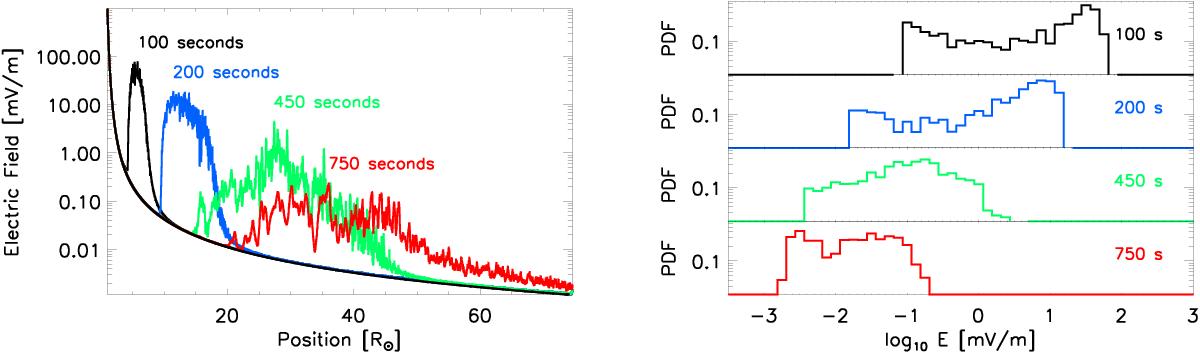
Lefta): electric field as a function of distance induced by an electron beam injected in the solar corona and propagating out through the solar corona and the solar wind. The electric field is displayed at 100, 200, 450 and 750 s after injection. Right b): probability density function of log E for 100, 200, 450 and 750 s after electron injection from top to bottom panel. The bin size is 0.125 in log space.
Current usage metrics show cumulative count of Article Views (full-text article views including HTML views, PDF and ePub downloads, according to the available data) and Abstracts Views on Vision4Press platform.
Data correspond to usage on the plateform after 2015. The current usage metrics is available 48-96 hours after online publication and is updated daily on week days.
Initial download of the metrics may take a while.