Free Access
Fig. 7
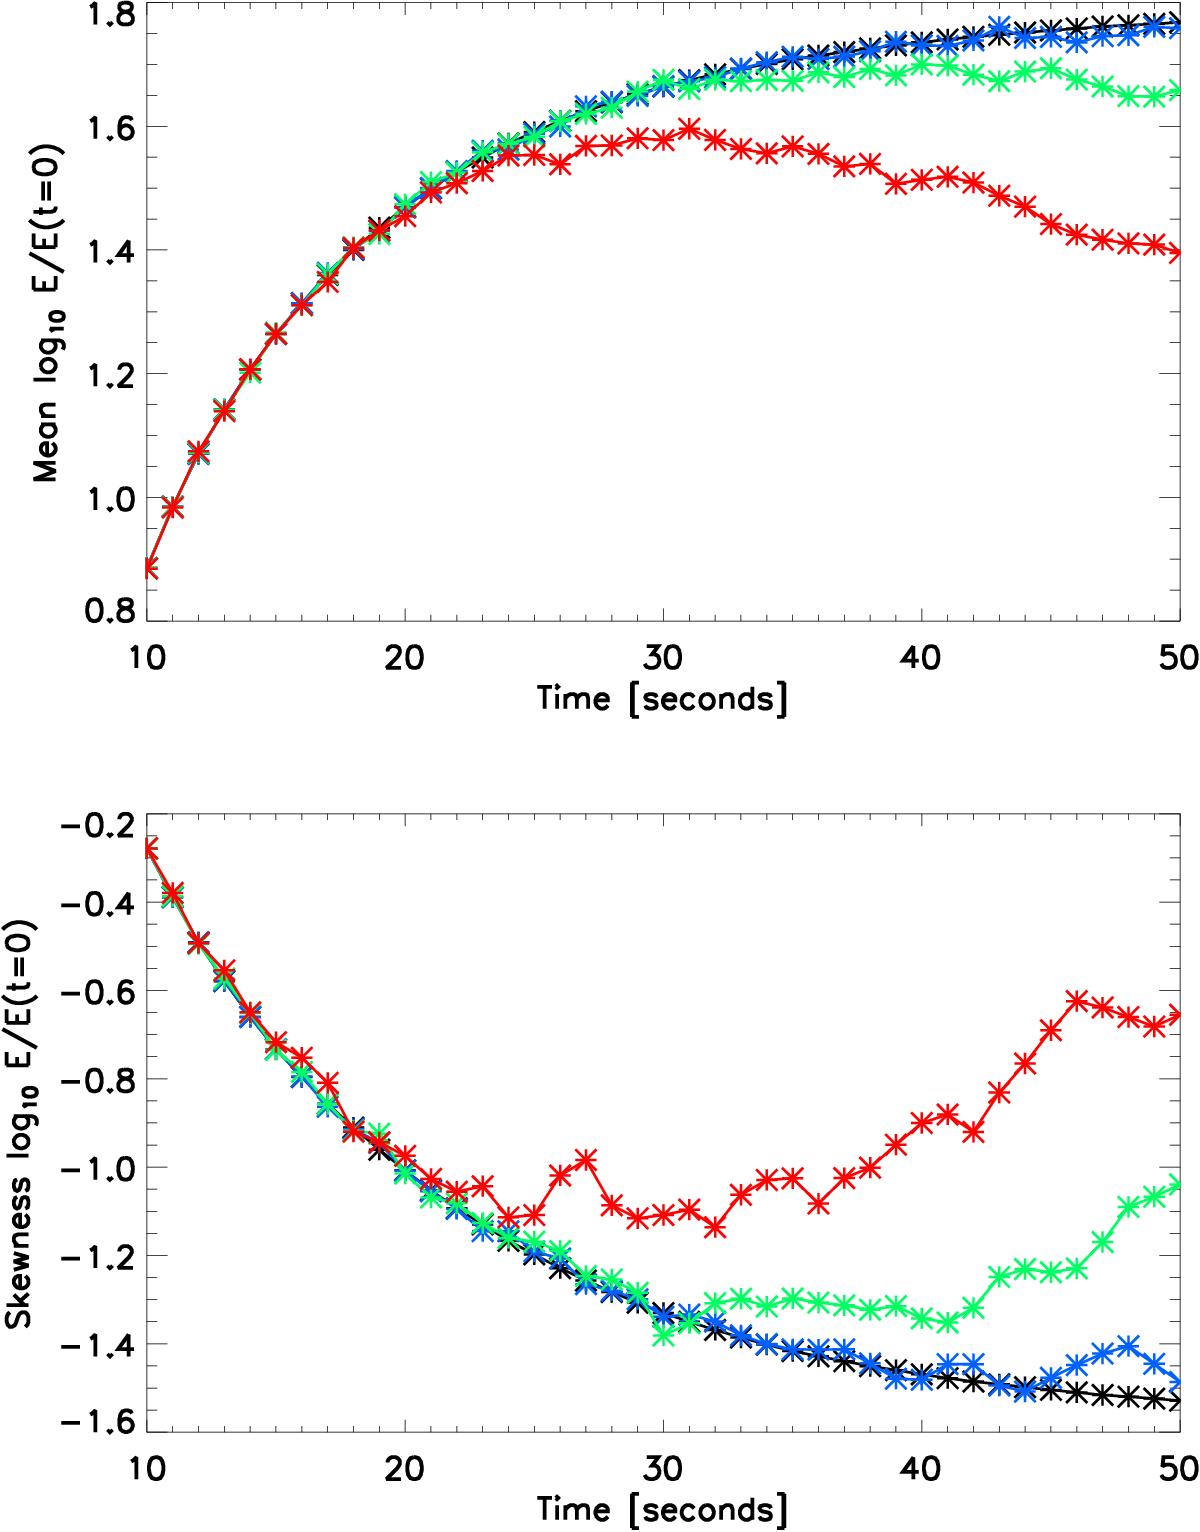
Time dependence of the mean and skewness of the log normalised electric field E/E(t = 0) between 10 and 50 s. Different colours relate to different levels of density fluctuations, similar to Fig. 6. The electron beam takes approximately 10 s before it start to produce significant levels of Langmuir waves.
This figure is made of several images, please see below:
Current usage metrics show cumulative count of Article Views (full-text article views including HTML views, PDF and ePub downloads, according to the available data) and Abstracts Views on Vision4Press platform.
Data correspond to usage on the plateform after 2015. The current usage metrics is available 48-96 hours after online publication and is updated daily on week days.
Initial download of the metrics may take a while.