Fig. 6
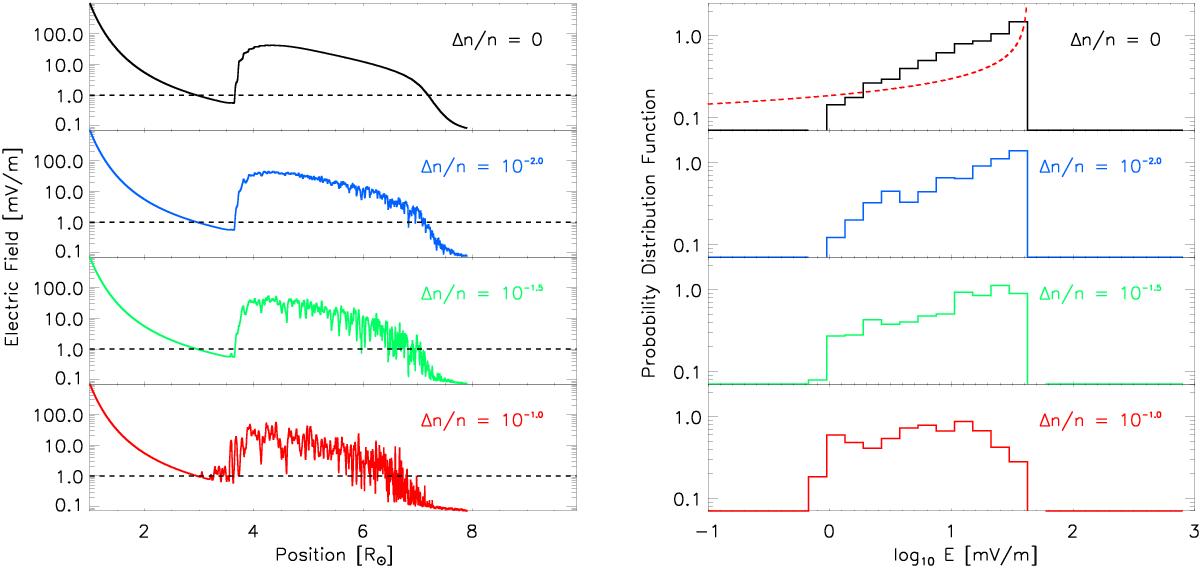
Lefta): electric field induced from an electron beam injected in the solar corona and propagating out from the Sun for different levels of ![]() with a decreasing mean background electron density, normalised at
with a decreasing mean background electron density, normalised at ![]() . The top panel has
. The top panel has ![]() . The remaining panels are normalised by
. The remaining panels are normalised by ![]() from top to bottom. The black dashed line indicates E = 1 mV/m used as a lower limit for the probability distribution function. Right b): probability distribution functions of log E. The bin size is 0.15 in log space. The top panel has Δn/n(r) = 0 where the red dashed line representing the PDF of a Gaussian fit with similar mean and standard deviation. The remaining panels have
from top to bottom. The black dashed line indicates E = 1 mV/m used as a lower limit for the probability distribution function. Right b): probability distribution functions of log E. The bin size is 0.15 in log space. The top panel has Δn/n(r) = 0 where the red dashed line representing the PDF of a Gaussian fit with similar mean and standard deviation. The remaining panels have ![]() normalised by Δn/n [1 AU] = 10-2,10-1.5,10-1from top to bottom.
normalised by Δn/n [1 AU] = 10-2,10-1.5,10-1from top to bottom.
Current usage metrics show cumulative count of Article Views (full-text article views including HTML views, PDF and ePub downloads, according to the available data) and Abstracts Views on Vision4Press platform.
Data correspond to usage on the plateform after 2015. The current usage metrics is available 48-96 hours after online publication and is updated daily on week days.
Initial download of the metrics may take a while.