Fig. 5
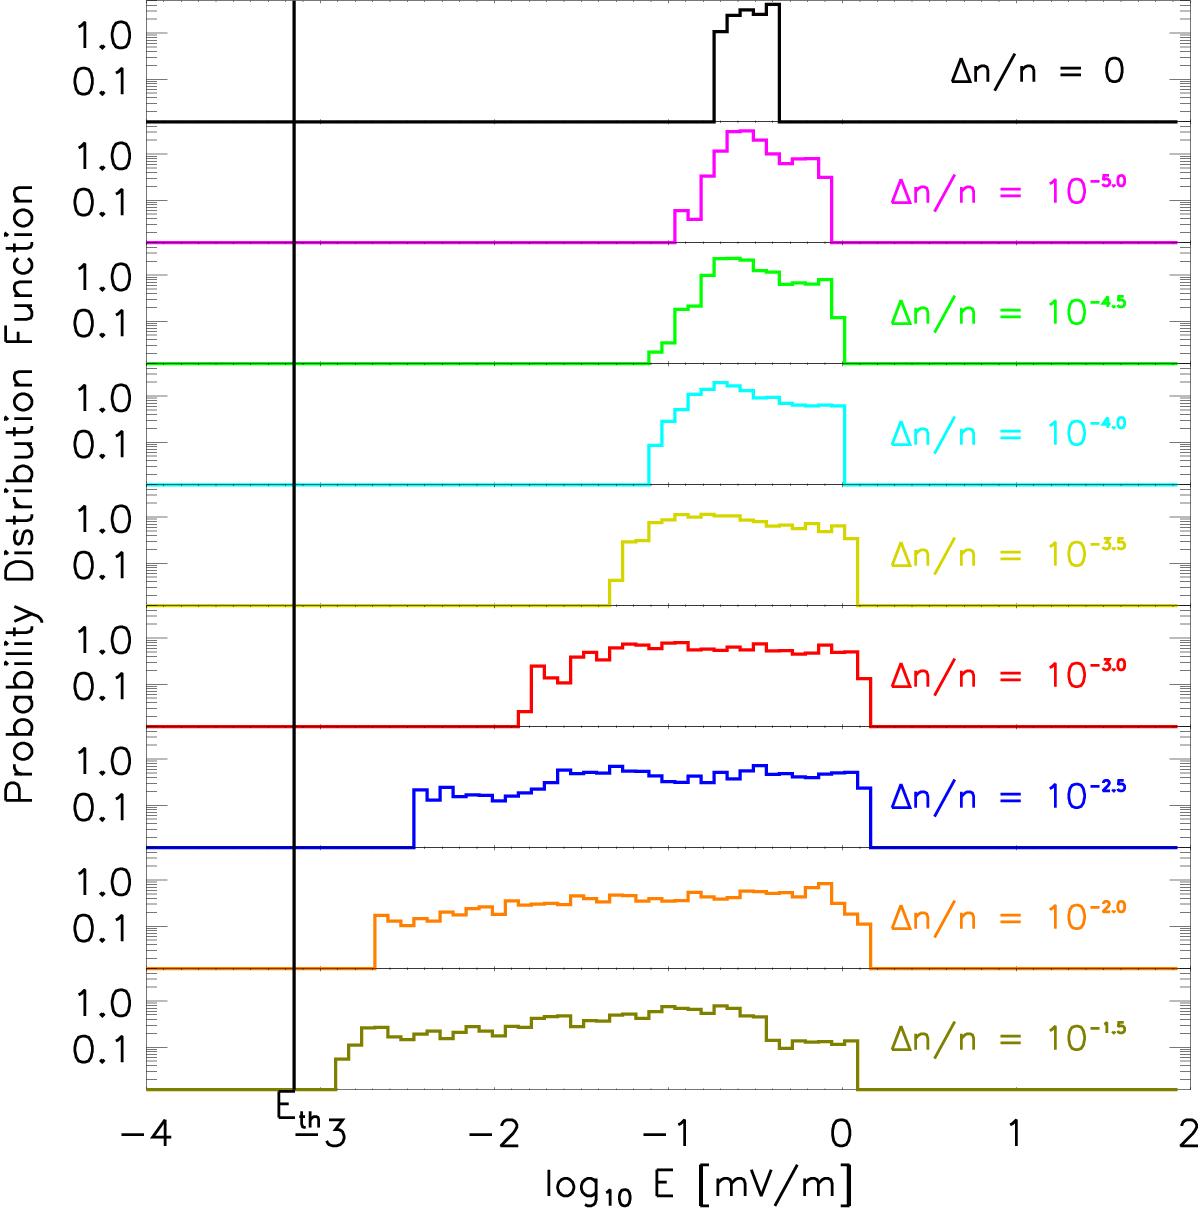
Probability distribution function of the electric field at t = 277 s that is induced from the central part of the electron beam where E> 0.22 mV/m in the unperturbed case. The top panel has Δn/n = 0. The remaining panels increase Δn/n from Δn/n = 10-5 to Δn/n = 10-1.5 in the bottom panel, as indicated on the right-hand side. The black vertical line indicates the thermal level of the electric field from Langmuir waves.
Current usage metrics show cumulative count of Article Views (full-text article views including HTML views, PDF and ePub downloads, according to the available data) and Abstracts Views on Vision4Press platform.
Data correspond to usage on the plateform after 2015. The current usage metrics is available 48-96 hours after online publication and is updated daily on week days.
Initial download of the metrics may take a while.