Free Access
Fig. 4
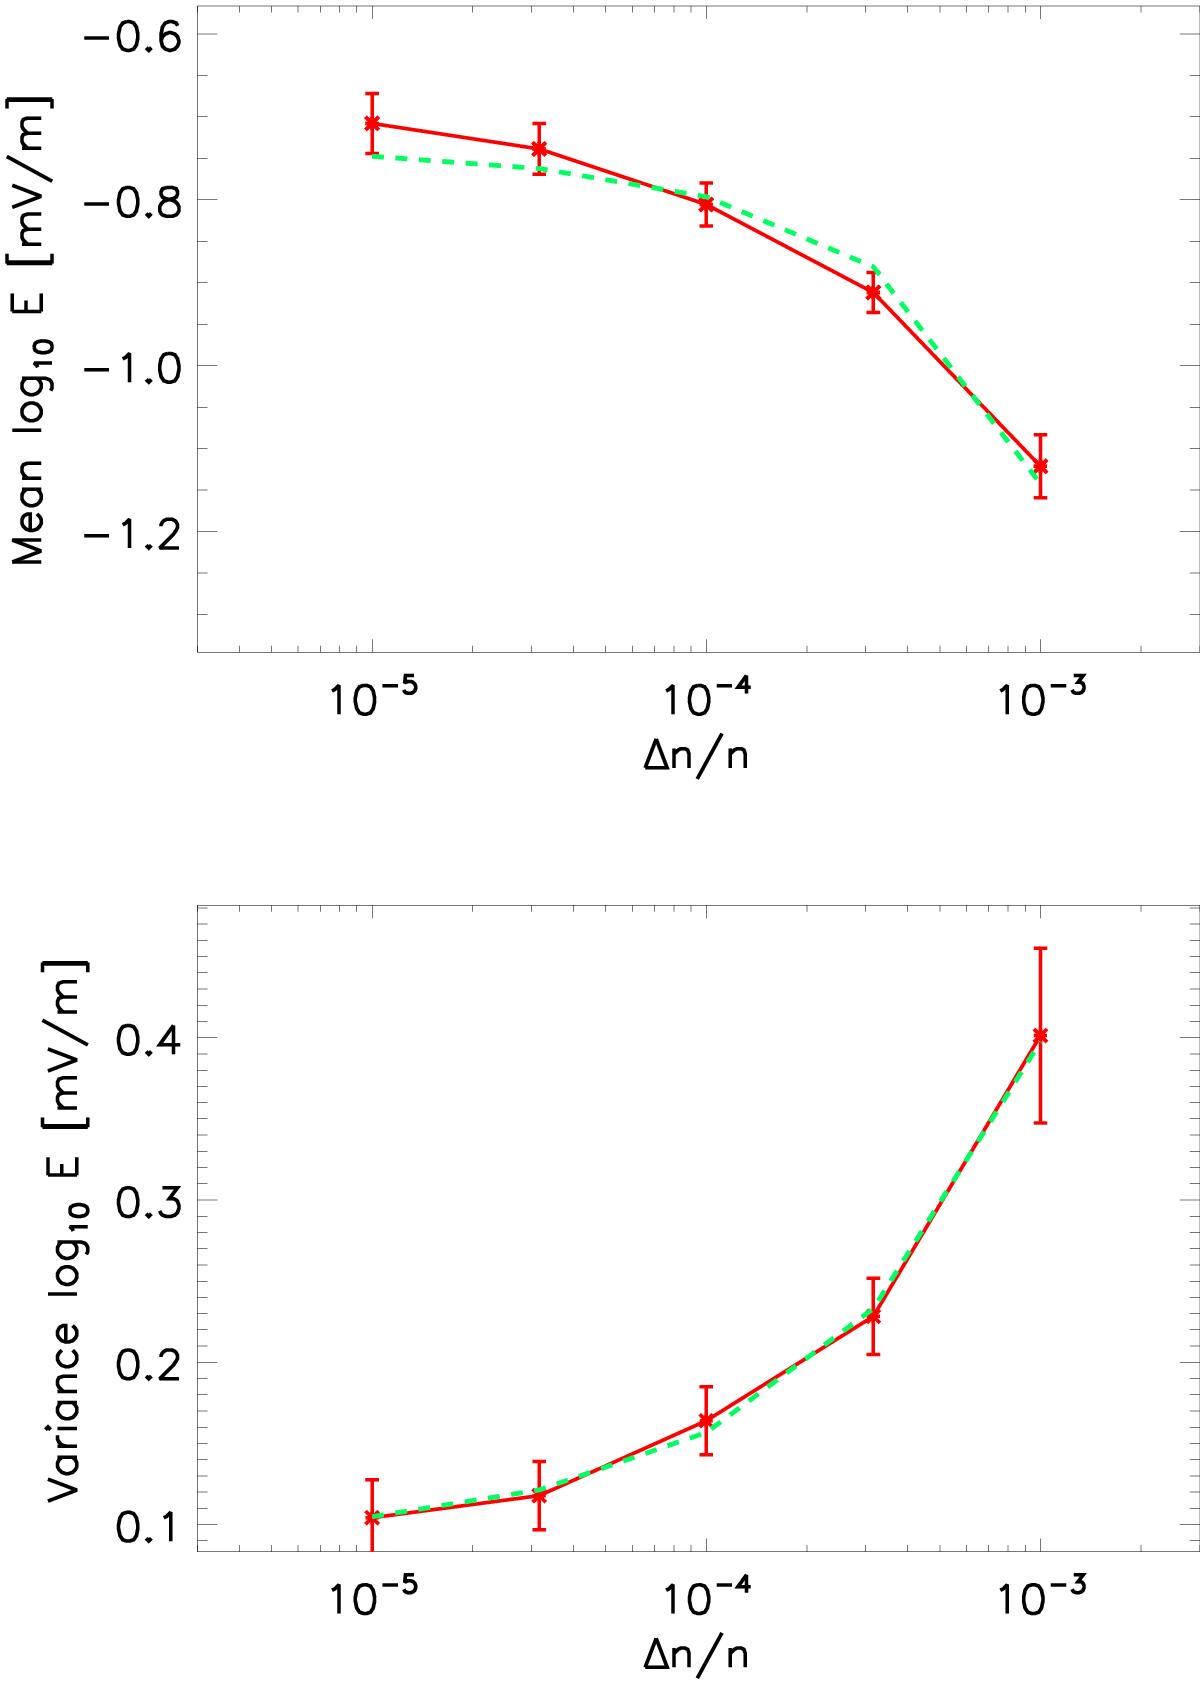
Mean and variance from a Gaussian fit to P(log E) above 0.01 mV/m as a function of Δn/n. A fit to the data is shown by the dashed green line using Eq. (12) for c3 = 2/3. The inverse of Eq. (12) is shown over the log-variance by the green dashed line for c3 = 2/3. For a discussion of the fits, see Sect. 7.
This figure is made of several images, please see below:
Current usage metrics show cumulative count of Article Views (full-text article views including HTML views, PDF and ePub downloads, according to the available data) and Abstracts Views on Vision4Press platform.
Data correspond to usage on the plateform after 2015. The current usage metrics is available 48-96 hours after online publication and is updated daily on week days.
Initial download of the metrics may take a while.