Free Access
Fig. 3
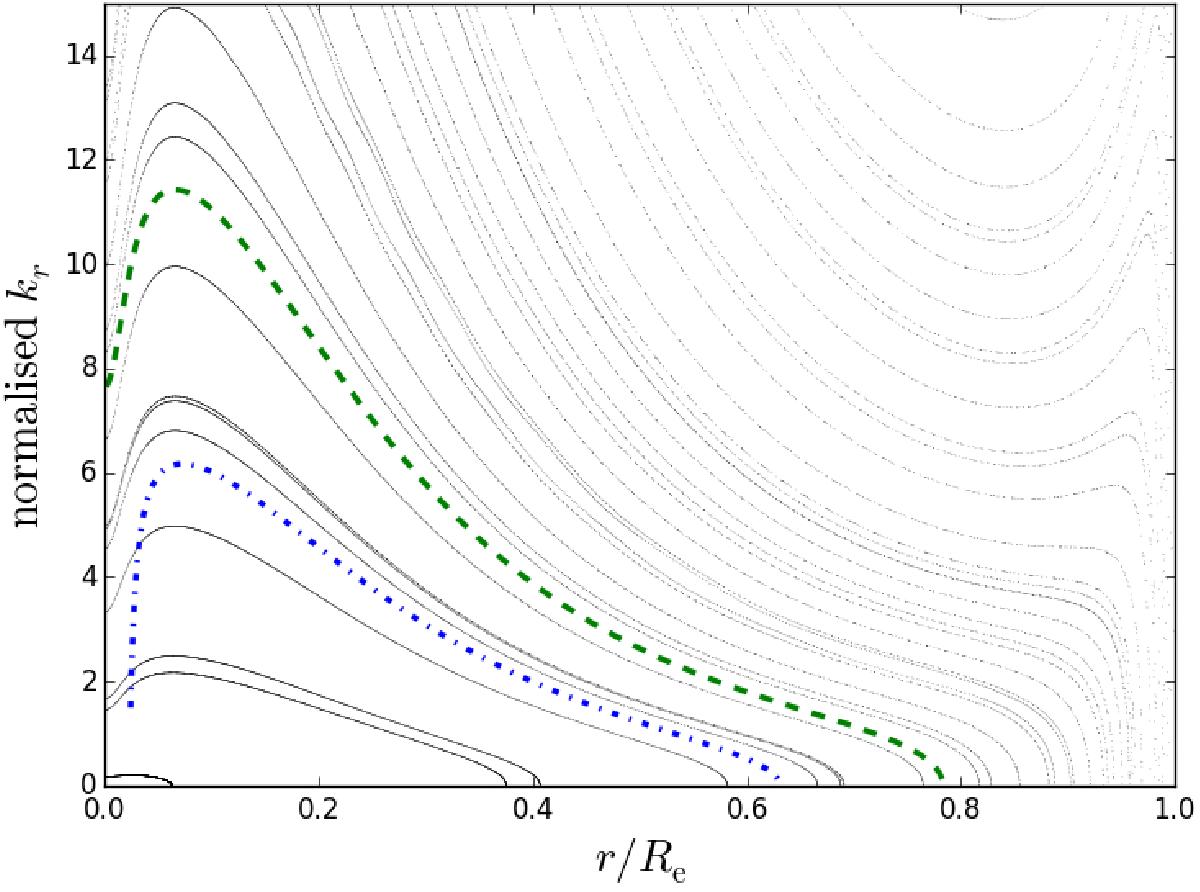
PSS of a polytropic model of star (with a polytropic index μ = 3) rotating at 38% of its critical velocity with ω/f = 0.8. The green dashed and blue dash-dotted lines are imprints of trajectories in the low-frequency approximation and in the traditional approximation, respectively.
Current usage metrics show cumulative count of Article Views (full-text article views including HTML views, PDF and ePub downloads, according to the available data) and Abstracts Views on Vision4Press platform.
Data correspond to usage on the plateform after 2015. The current usage metrics is available 48-96 hours after online publication and is updated daily on week days.
Initial download of the metrics may take a while.