Fig. 8
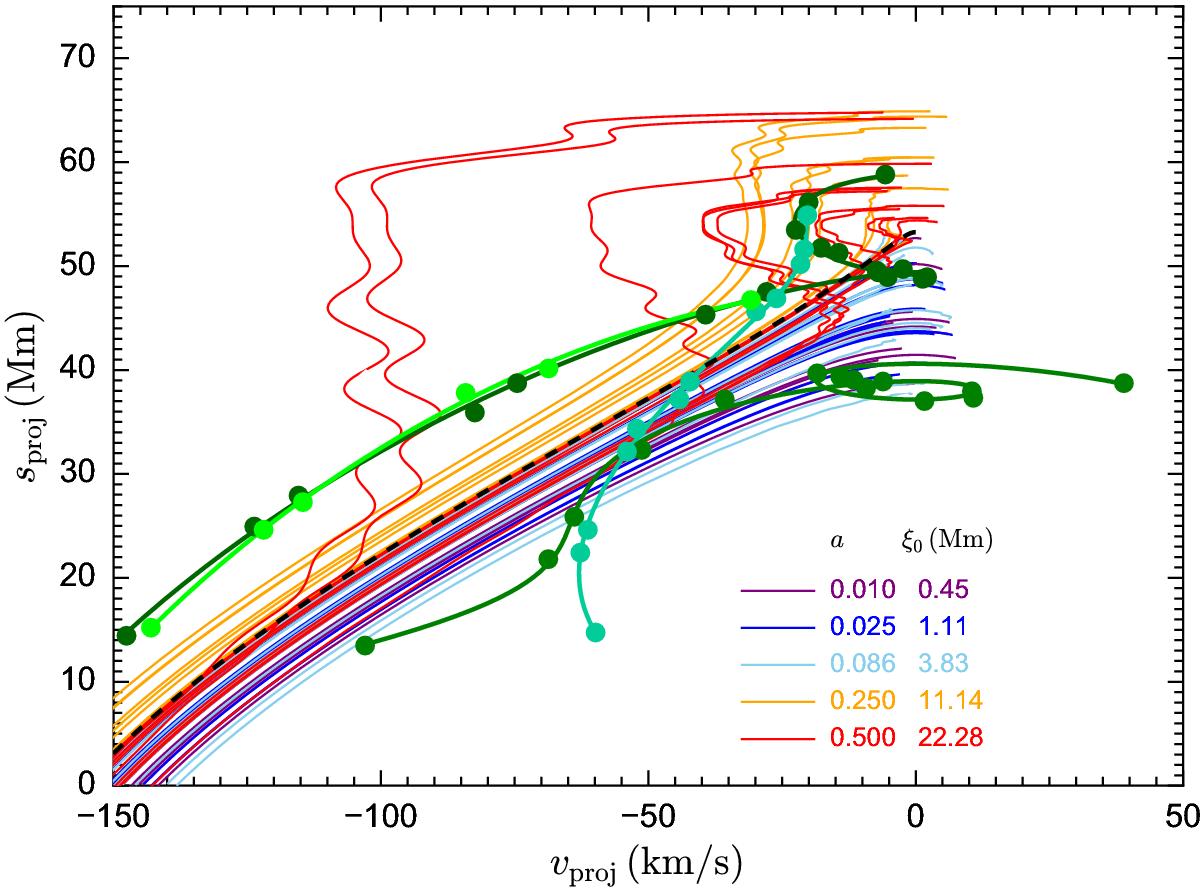
Phase diagram of projected position vs. velocity for the 5 measured coronal rain blobs (in green). The solid green lines are polynomial fits to the measurements. The solid thin curves are numerically generated paths for blobs of negligible mass starting at random positions between 0.3L and 0.65L and speeds between −25 km s-1 and 25 km s-1 for amplitudes ranging from a = 0.01 to 0.5.
Current usage metrics show cumulative count of Article Views (full-text article views including HTML views, PDF and ePub downloads, according to the available data) and Abstracts Views on Vision4Press platform.
Data correspond to usage on the plateform after 2015. The current usage metrics is available 48-96 hours after online publication and is updated daily on week days.
Initial download of the metrics may take a while.