Free Access
Fig. 7
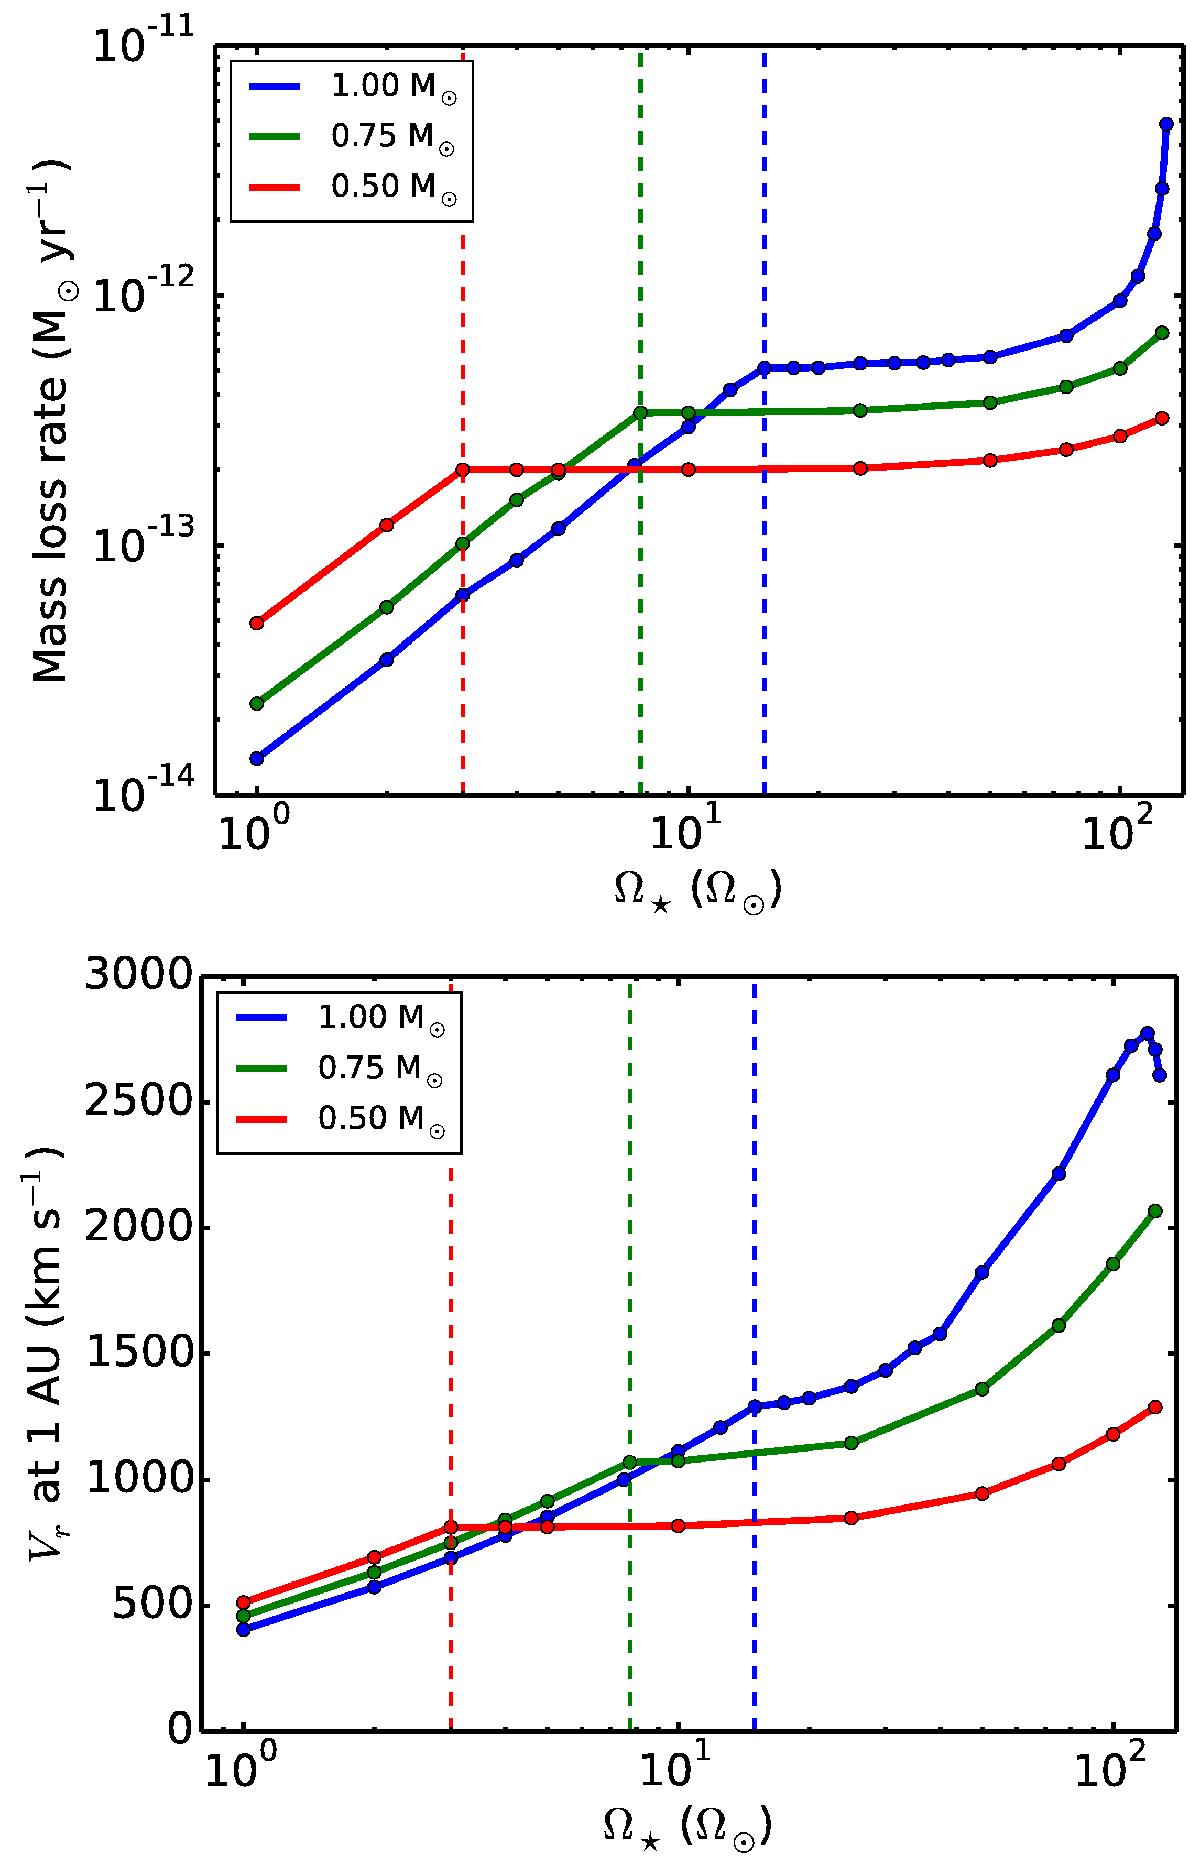
Mass loss rate (upper-panel) and radial outflow speed (lower-panel) as a function of rotation for three stellar masses. The small circles show the individual simulations and the vertical dashed lines show the saturation thresholds.
This figure is made of several images, please see below:
Current usage metrics show cumulative count of Article Views (full-text article views including HTML views, PDF and ePub downloads, according to the available data) and Abstracts Views on Vision4Press platform.
Data correspond to usage on the plateform after 2015. The current usage metrics is available 48-96 hours after online publication and is updated daily on week days.
Initial download of the metrics may take a while.