Free Access
Fig. 5
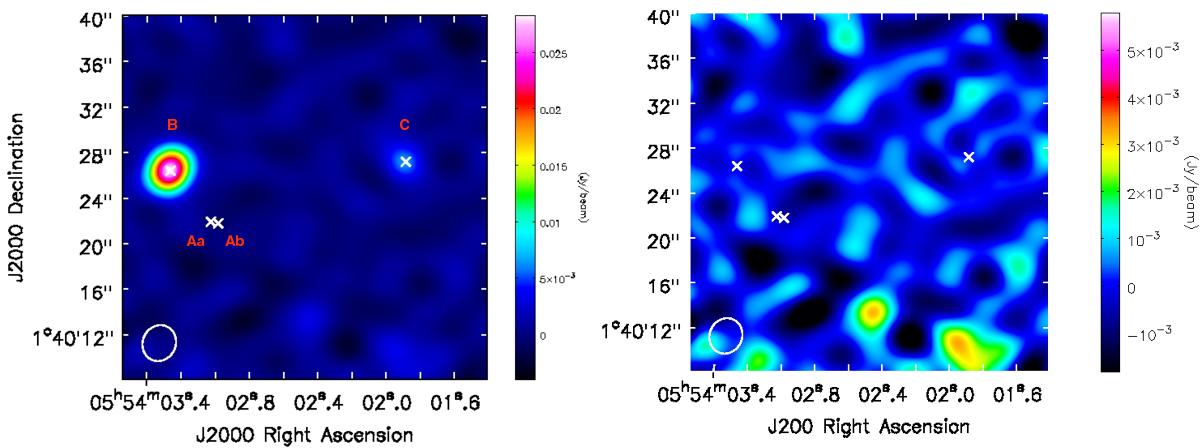
SMA 1.3 mm dust continuum image of the HBC 515 system (Aa+Ab, B and C; left) and residuals from 2D Gaussian fits of HBC 515B and C (right) where the position of each member is identified with white crosses. The beam size is shown in the lower left.
This figure is made of several images, please see below:
Current usage metrics show cumulative count of Article Views (full-text article views including HTML views, PDF and ePub downloads, according to the available data) and Abstracts Views on Vision4Press platform.
Data correspond to usage on the plateform after 2015. The current usage metrics is available 48-96 hours after online publication and is updated daily on week days.
Initial download of the metrics may take a while.