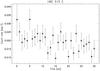
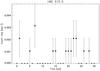
Fig. 4
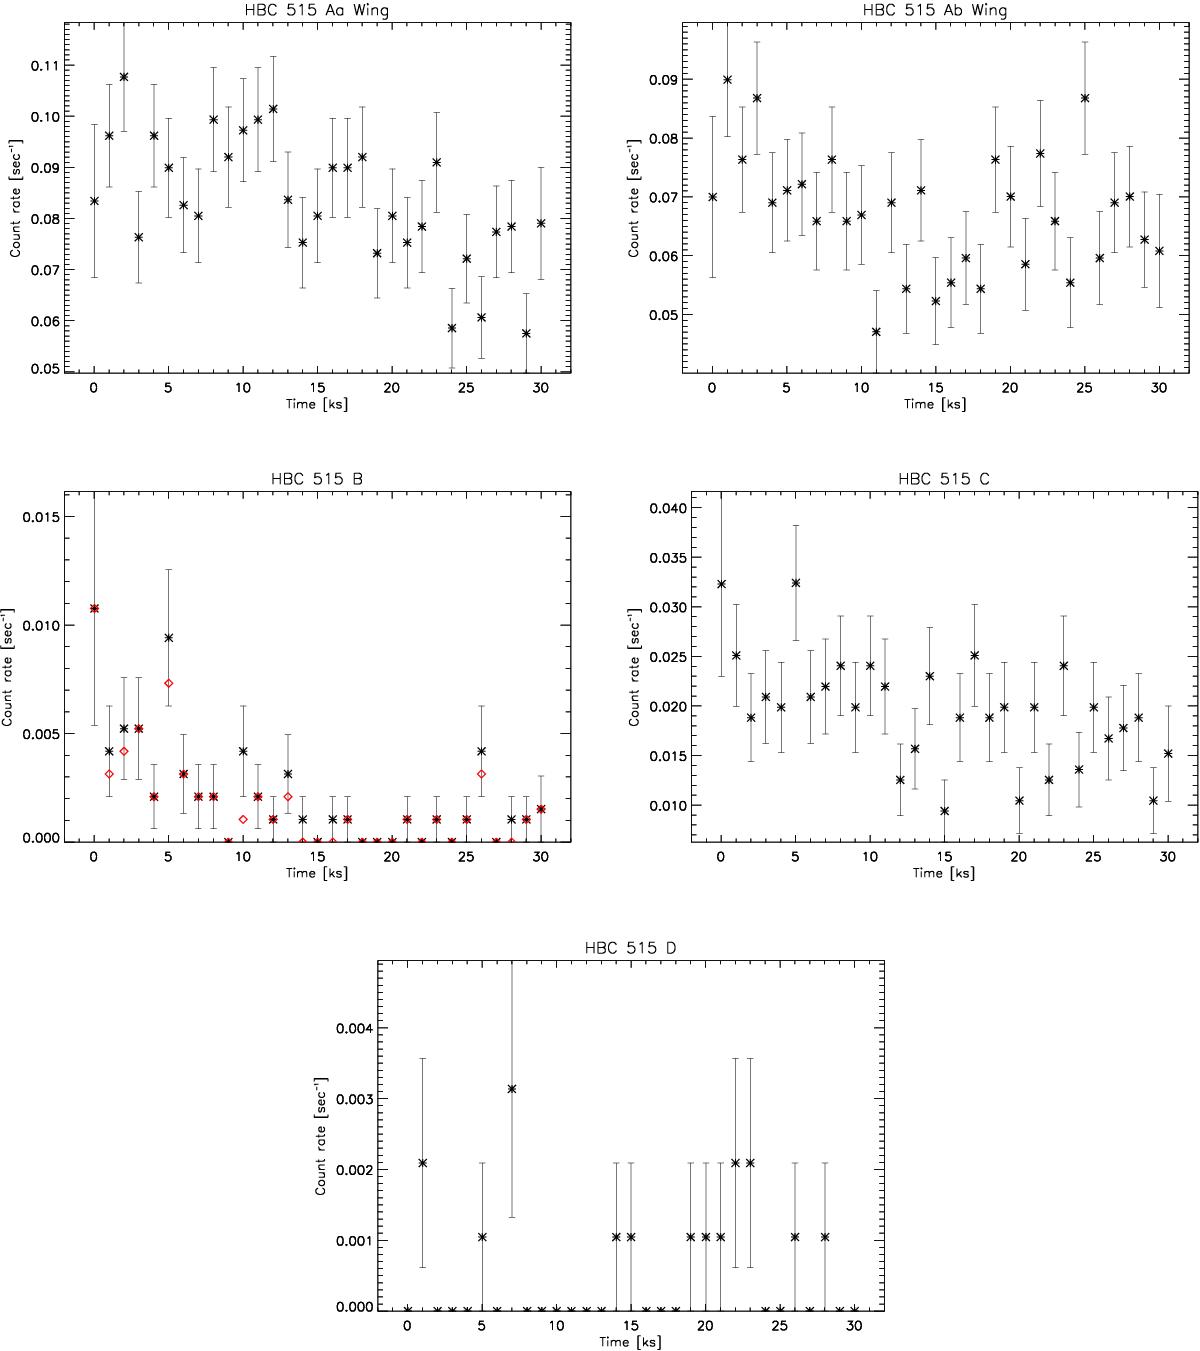
HBC 515 X-ray light curves during the course of the ~29 ks observation with time bins of 1 ks and 1σ count rate errors overlaid. Time t = 0 corresponds to the start of the observation. Light curves for HBC 515B were extracted from the 0.3–8.0 keV band (black) and 2.0–8.0 keV band (red diamond) to highlight the 0.3–2.0 keV contamination from the readout streak (Sect. 3.1.2).
Current usage metrics show cumulative count of Article Views (full-text article views including HTML views, PDF and ePub downloads, according to the available data) and Abstracts Views on Vision4Press platform.
Data correspond to usage on the plateform after 2015. The current usage metrics is available 48-96 hours after online publication and is updated daily on week days.
Initial download of the metrics may take a while.