Free Access
Fig. 5
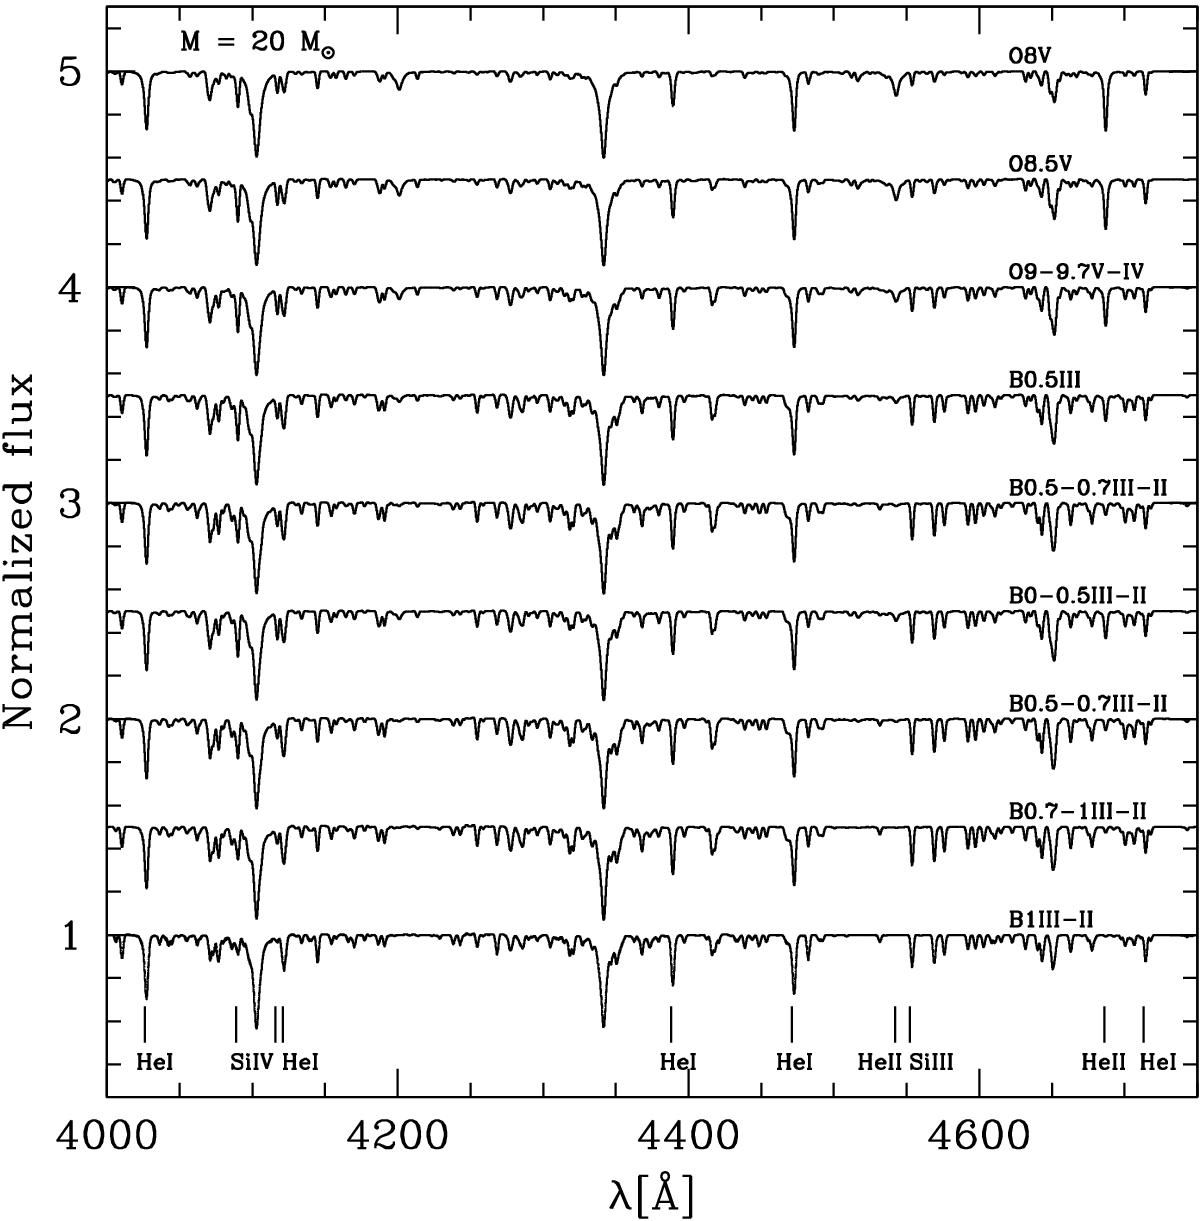
Spectroscopic sequence along the M = 20M⊙ evolutionary track, from top to bottom, between 4000 and 4750 Å. The main classification lines are indicated. The spectra have been shifted by 0.5 for clarity.
Current usage metrics show cumulative count of Article Views (full-text article views including HTML views, PDF and ePub downloads, according to the available data) and Abstracts Views on Vision4Press platform.
Data correspond to usage on the plateform after 2015. The current usage metrics is available 48-96 hours after online publication and is updated daily on week days.
Initial download of the metrics may take a while.