Fig. 4
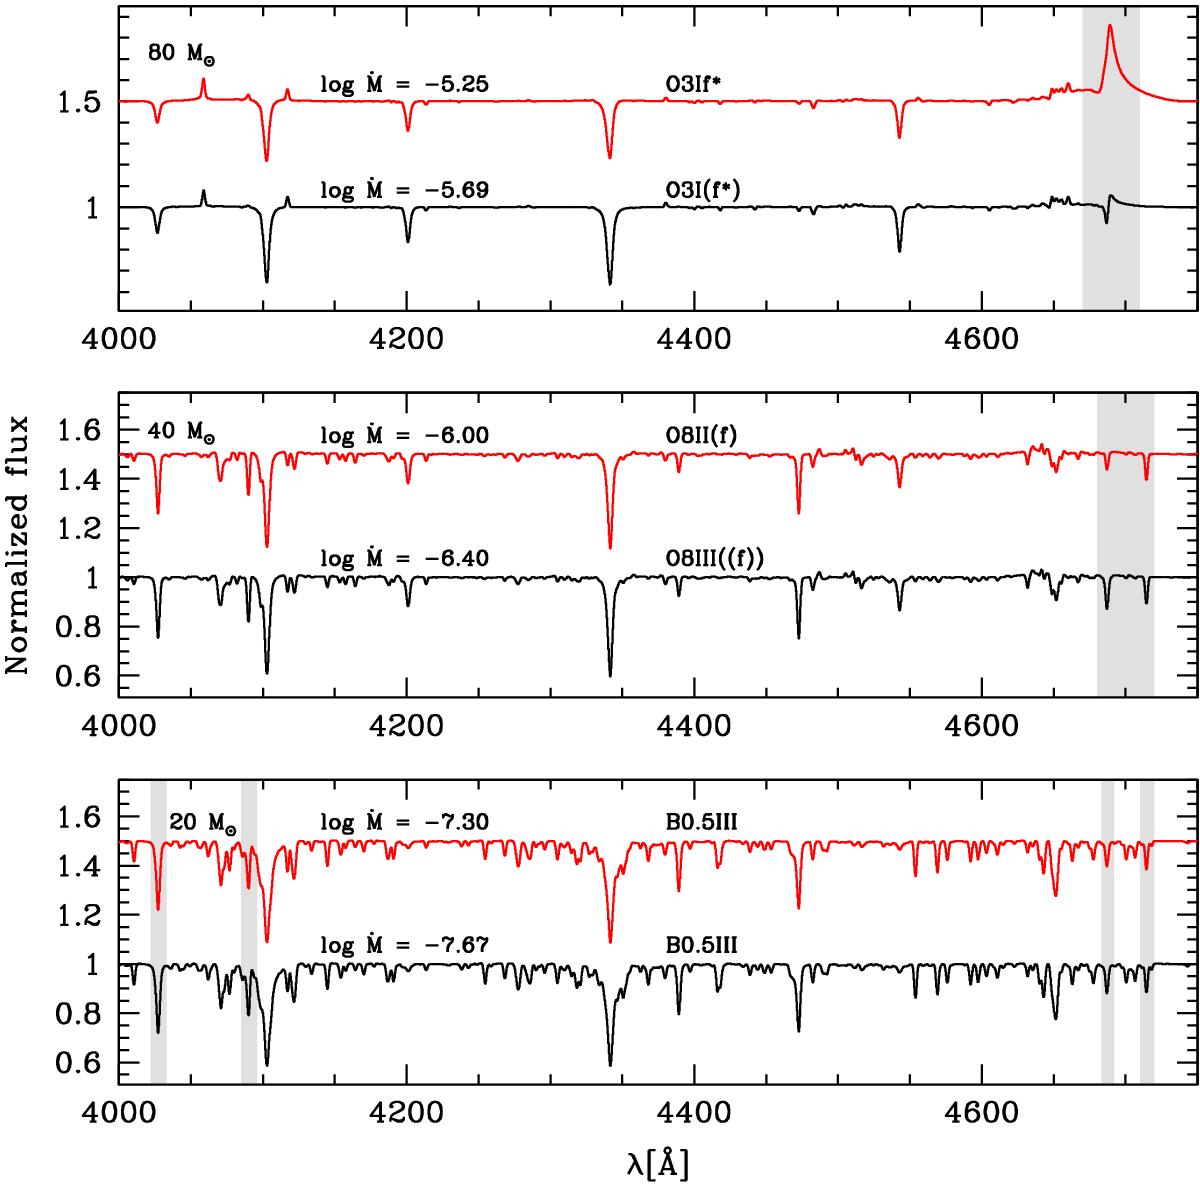
Effect of a change in mass-loss rate on the spectral classification. In each panel, the bottom black spectrum is the initial model, while the upper red one is the same model in which the mass-loss rate has been increased by a factor ~2.5 (only in the atmosphere model). The upper (middle, lower) panel corresponds to a model with an initial mass of 80 (40, 20) M⊙. More information on the models is available in Table A.1. Shaded areas highlight the main luminosity-class diagnostic lines.
Current usage metrics show cumulative count of Article Views (full-text article views including HTML views, PDF and ePub downloads, according to the available data) and Abstracts Views on Vision4Press platform.
Data correspond to usage on the plateform after 2015. The current usage metrics is available 48-96 hours after online publication and is updated daily on week days.
Initial download of the metrics may take a while.