Free Access
Fig. 2
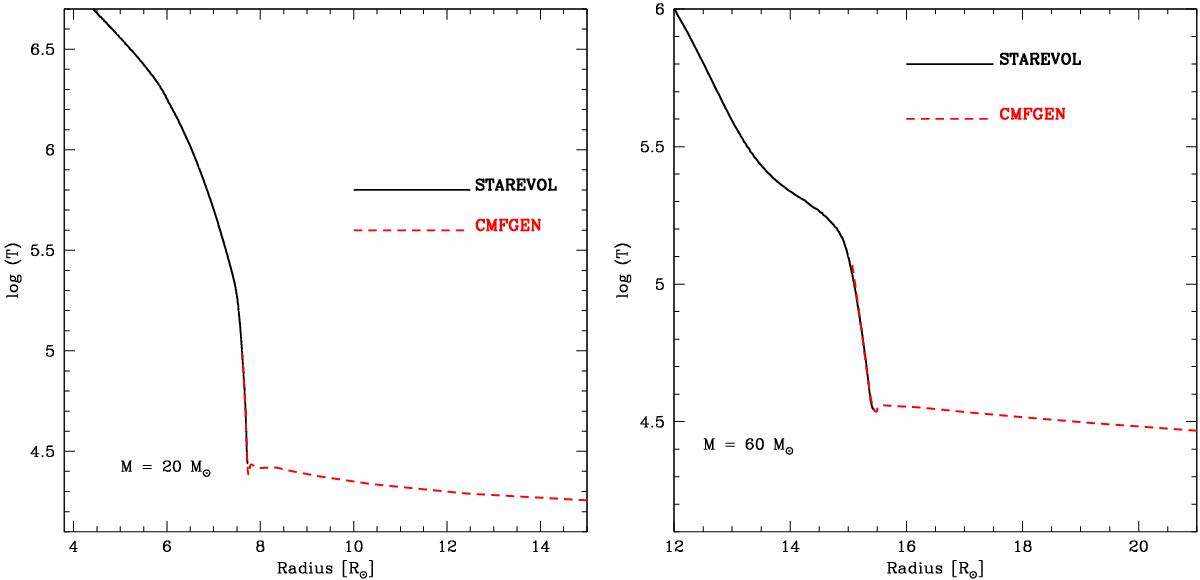
Temperature as a function of radius in the evolutionary model (black solid line) and the atmosphere model (red dashed line) for representative points of the main sequence. The left (right) panel is for a model with M = 20(60)M⊙.
This figure is made of several images, please see below:
Current usage metrics show cumulative count of Article Views (full-text article views including HTML views, PDF and ePub downloads, according to the available data) and Abstracts Views on Vision4Press platform.
Data correspond to usage on the plateform after 2015. The current usage metrics is available 48-96 hours after online publication and is updated daily on week days.
Initial download of the metrics may take a while.