Fig. A.1
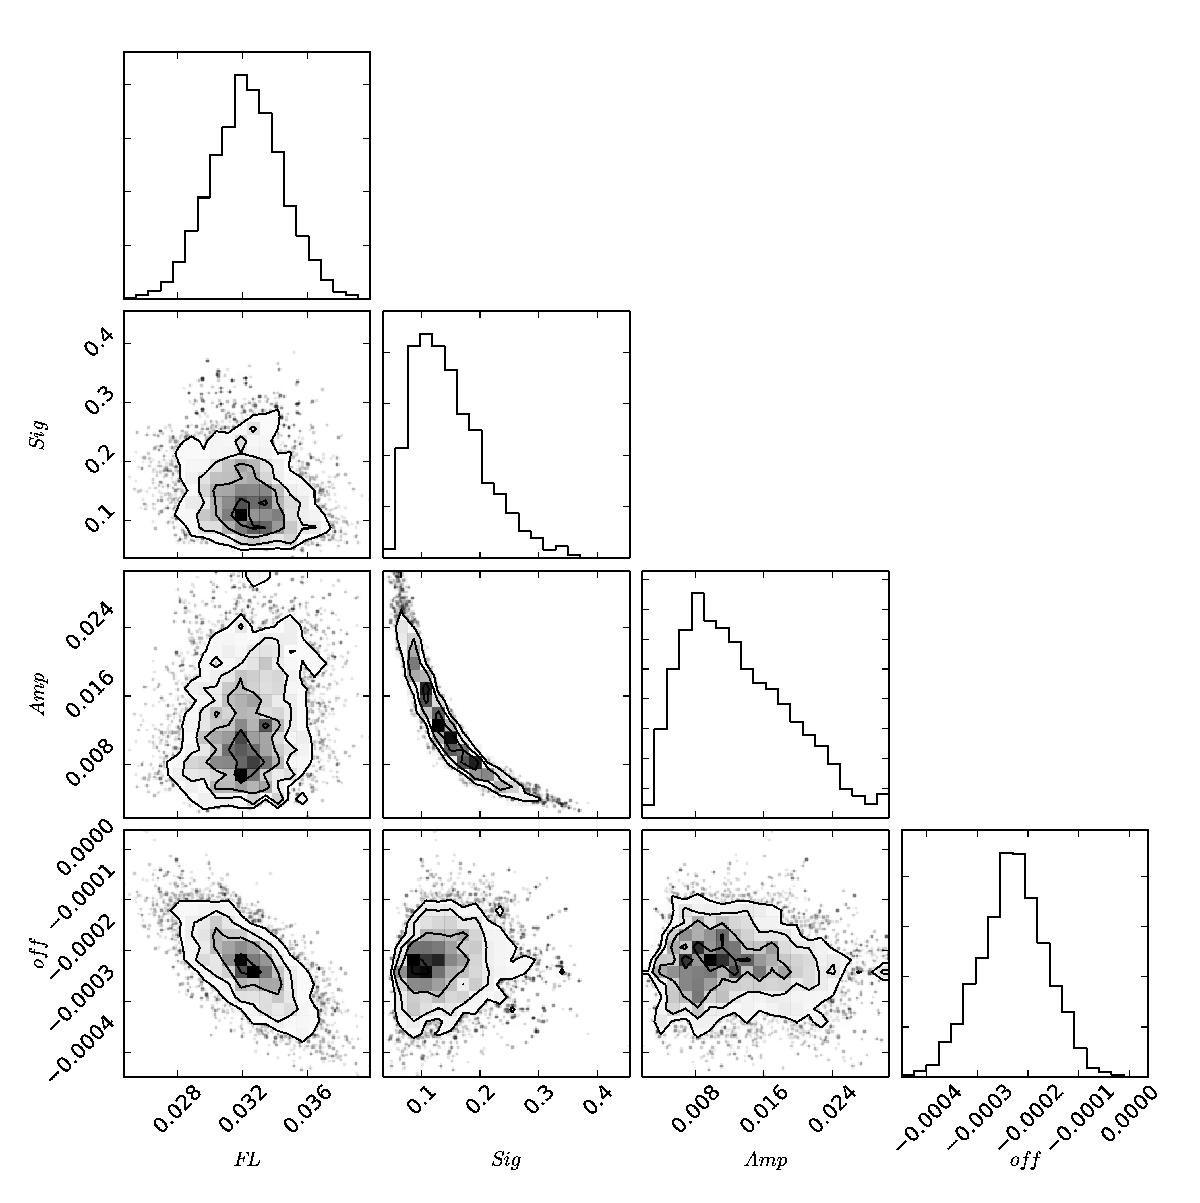
Posterior distributions of the model parameters fitted in this work in the shape of histograms, along with their correlation plots. Values are computed from the 1.5 Å excess light curve around the sodium D2 line. Here FL is the flare scaling parameter, Sig is the width of the exoplanetary Gaussian profile, Amp is the amplitude of the exoplanetary Gaussian profile, and off is the normalization constant for the flare model.
Current usage metrics show cumulative count of Article Views (full-text article views including HTML views, PDF and ePub downloads, according to the available data) and Abstracts Views on Vision4Press platform.
Data correspond to usage on the plateform after 2015. The current usage metrics is available 48-96 hours after online publication and is updated daily on week days.
Initial download of the metrics may take a while.