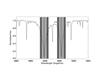
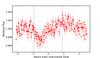
Fig. 3

Integration bands and derived excess light curve. Left: gray shaded areas show the integration bands with passband of 1 Å, 1.5 Å, and 3 Å, centered at the core of each sodium line. The red and blue intervals show the passbands of the reference bands for D2 and D1, respectively. Right: the raw excess light curve shown with the red circles for the 1.5 Å integration band inside the sodium D2 line. Dashed vertical lines indicate times of ingress and egress.
Current usage metrics show cumulative count of Article Views (full-text article views including HTML views, PDF and ePub downloads, according to the available data) and Abstracts Views on Vision4Press platform.
Data correspond to usage on the plateform after 2015. The current usage metrics is available 48-96 hours after online publication and is updated daily on week days.
Initial download of the metrics may take a while.