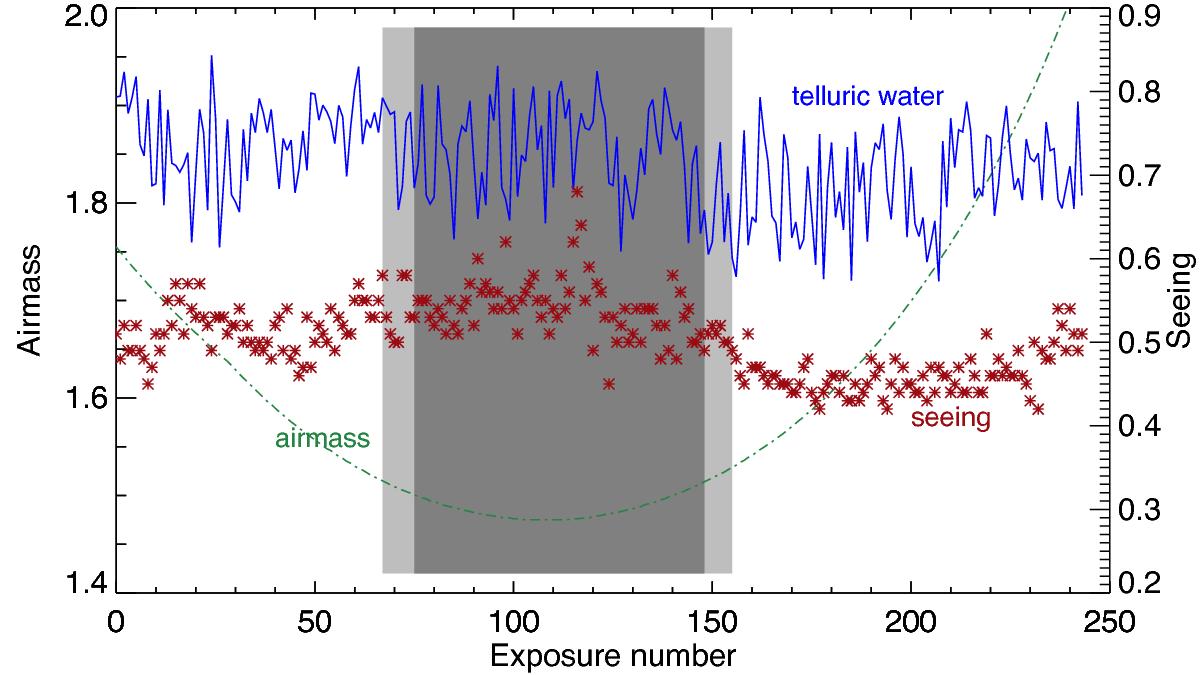
Fig. 1

Sky conditions during our observations. The airmass is indicated with a green dashed line and the red cross points indicate the seeing, in arcsec. The measured strength of several strong telluric water lines are shown with solid blue lines. These values are artificially shifted to fit inside the plot. Gray areas show the time between transit ingress and egress. Dark gray is the transit at full depth.
Current usage metrics show cumulative count of Article Views (full-text article views including HTML views, PDF and ePub downloads, according to the available data) and Abstracts Views on Vision4Press platform.
Data correspond to usage on the plateform after 2015. The current usage metrics is available 48-96 hours after online publication and is updated daily on week days.
Initial download of the metrics may take a while.


