Fig. 9
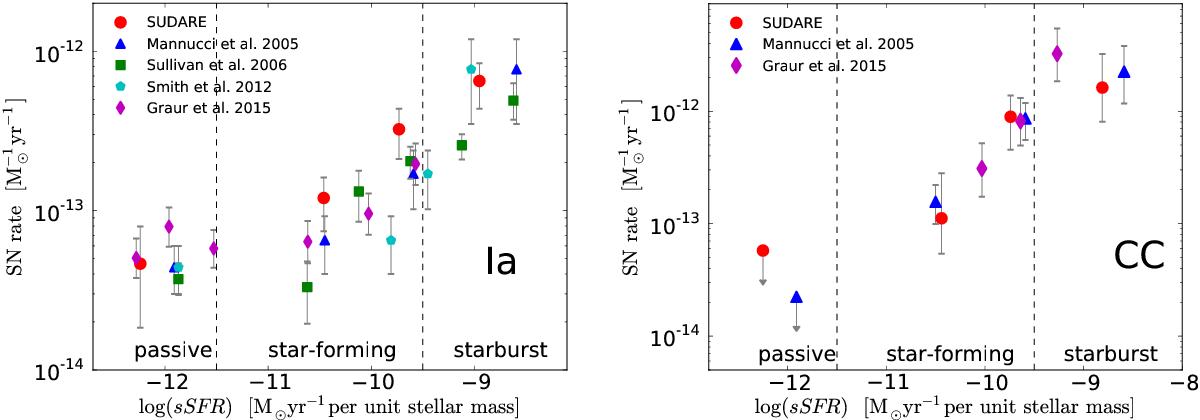
SN rates in SNuM vs. sSFR for Type Ia (left panel) and CC SNe (right panel) in three different groups of galaxies based on their sSFR: the first group of passive galaxies with a zero mean SFR; the second group of galaxies with −12.0 < log (sSFR) < −9.5; third group of galaxies with log (sSFR) > −9.5. In both panels the circles are from SUDARE, the triangles from Mannucci et al. (2005), the squares from Sullivan et al. (2006), the pentagons are from Smith et al. (2012) and the diamonds from Graur et al. (2015). The literature values have been corrected to a Salpeter IMF.
Current usage metrics show cumulative count of Article Views (full-text article views including HTML views, PDF and ePub downloads, according to the available data) and Abstracts Views on Vision4Press platform.
Data correspond to usage on the plateform after 2015. The current usage metrics is available 48-96 hours after online publication and is updated daily on week days.
Initial download of the metrics may take a while.