Fig. B.1
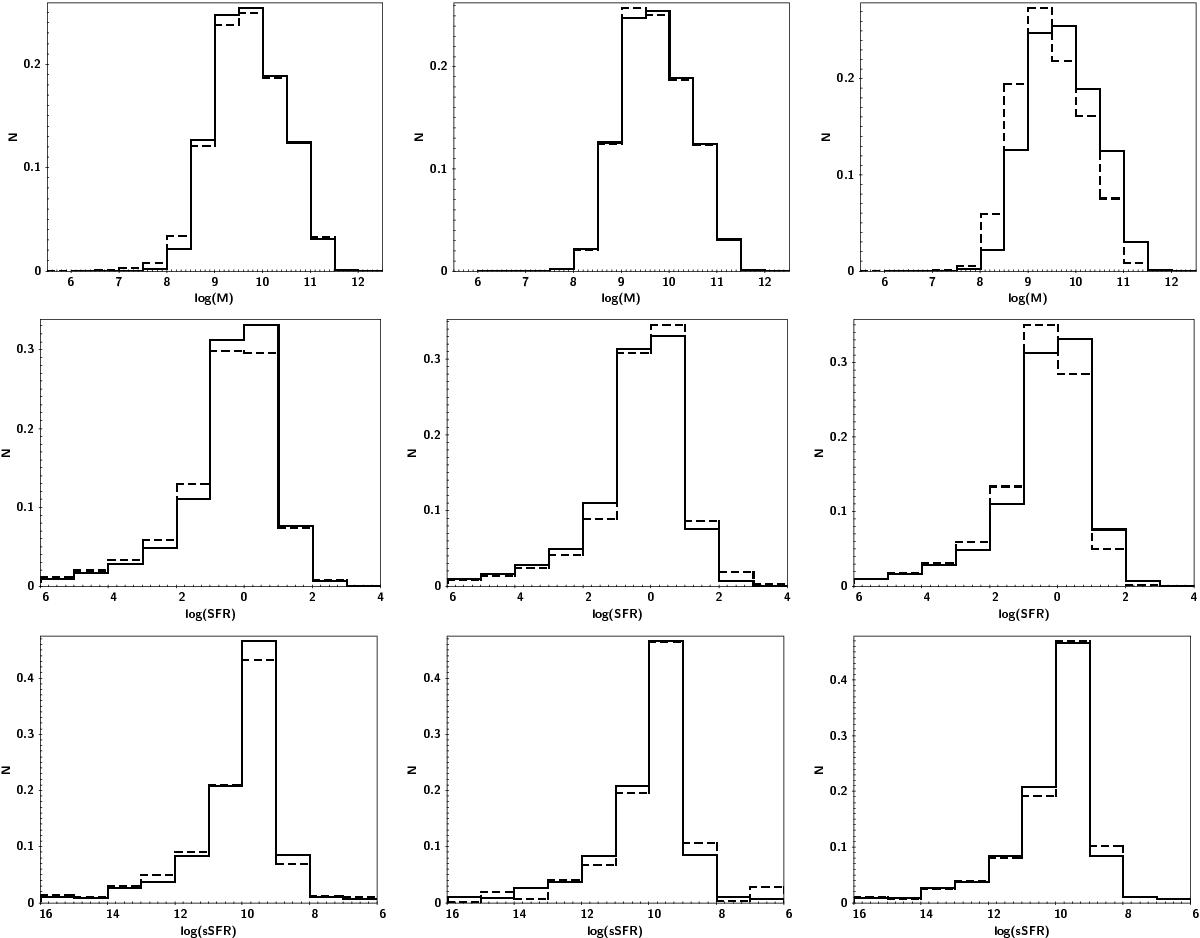
Top panel: the different distributions of stellar masses for galaxies in CDFS obtained from the SED fitting assuming, in the left panel, zpeak (black line) and zMC (dotted line), in the middle panel ψ ∝ exp(−t/τ (black line) and ψdel ∝ t × exp(−t/τ (dotted line), in the right panel a Salpeter (black line) and Chabrier (dotted line) IMF. Middle panel: the different distributions of SFRs for galaxies in CDFS obtained from the SED fitting assuming, in theleft panel, zpeak (black line) and zMC (dotted line), in the middle panel ψ ∝ exp(−t/τ (black line) and ψdel ∝ t × exp(−t/τ (dotted line), in the right panel a Salpeter (black line) and Chabrier (dotted line) IMF. Bottom panel: the different distributions of sSFR for galaxies in CDFS obtained from the SED fitting assuming, in the left panel, zpeak (black line) and zMC (dotted line), in the middle panel ψ ∝ exp(−t/τ (black line) and ψdel ∝ t × exp(−t/τ (dotted line), in the right panel a Salpeter (black line) and Chabrier (dotted line) IMF.
Current usage metrics show cumulative count of Article Views (full-text article views including HTML views, PDF and ePub downloads, according to the available data) and Abstracts Views on Vision4Press platform.
Data correspond to usage on the plateform after 2015. The current usage metrics is available 48-96 hours after online publication and is updated daily on week days.
Initial download of the metrics may take a while.