Free Access
Fig. 17
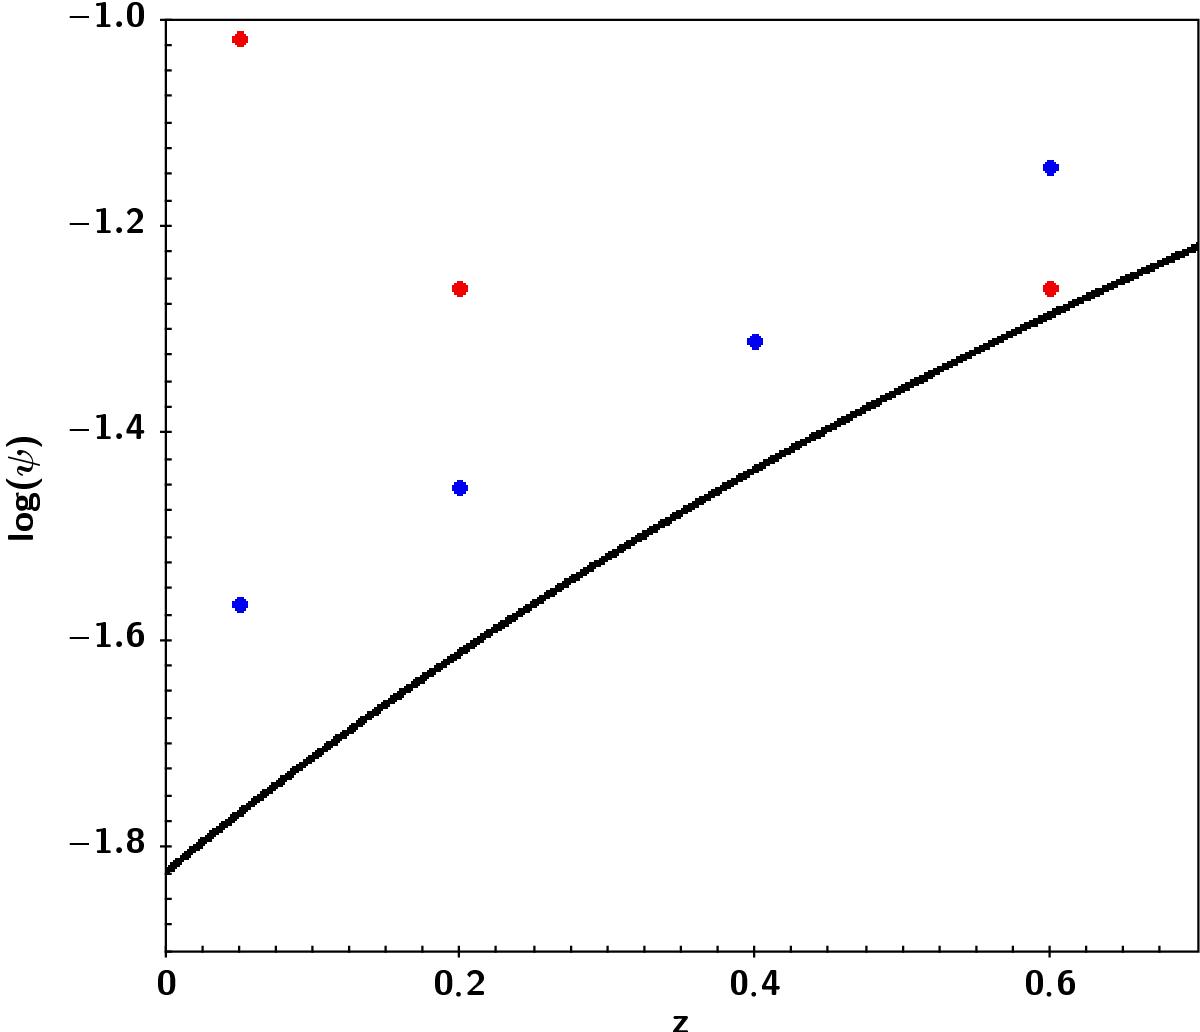
SFR density as a function of redshift. The black line is the analytical function from Madau & Dickinson (2014). The red circles are measurements from SFRs in the COSMOS galaxy sample estimated by FAST SED fitting, while the blue points are measurements using UV and NIR luminosity by Muzzin et al. (2013a).
Current usage metrics show cumulative count of Article Views (full-text article views including HTML views, PDF and ePub downloads, according to the available data) and Abstracts Views on Vision4Press platform.
Data correspond to usage on the plateform after 2015. The current usage metrics is available 48-96 hours after online publication and is updated daily on week days.
Initial download of the metrics may take a while.