Fig. 16
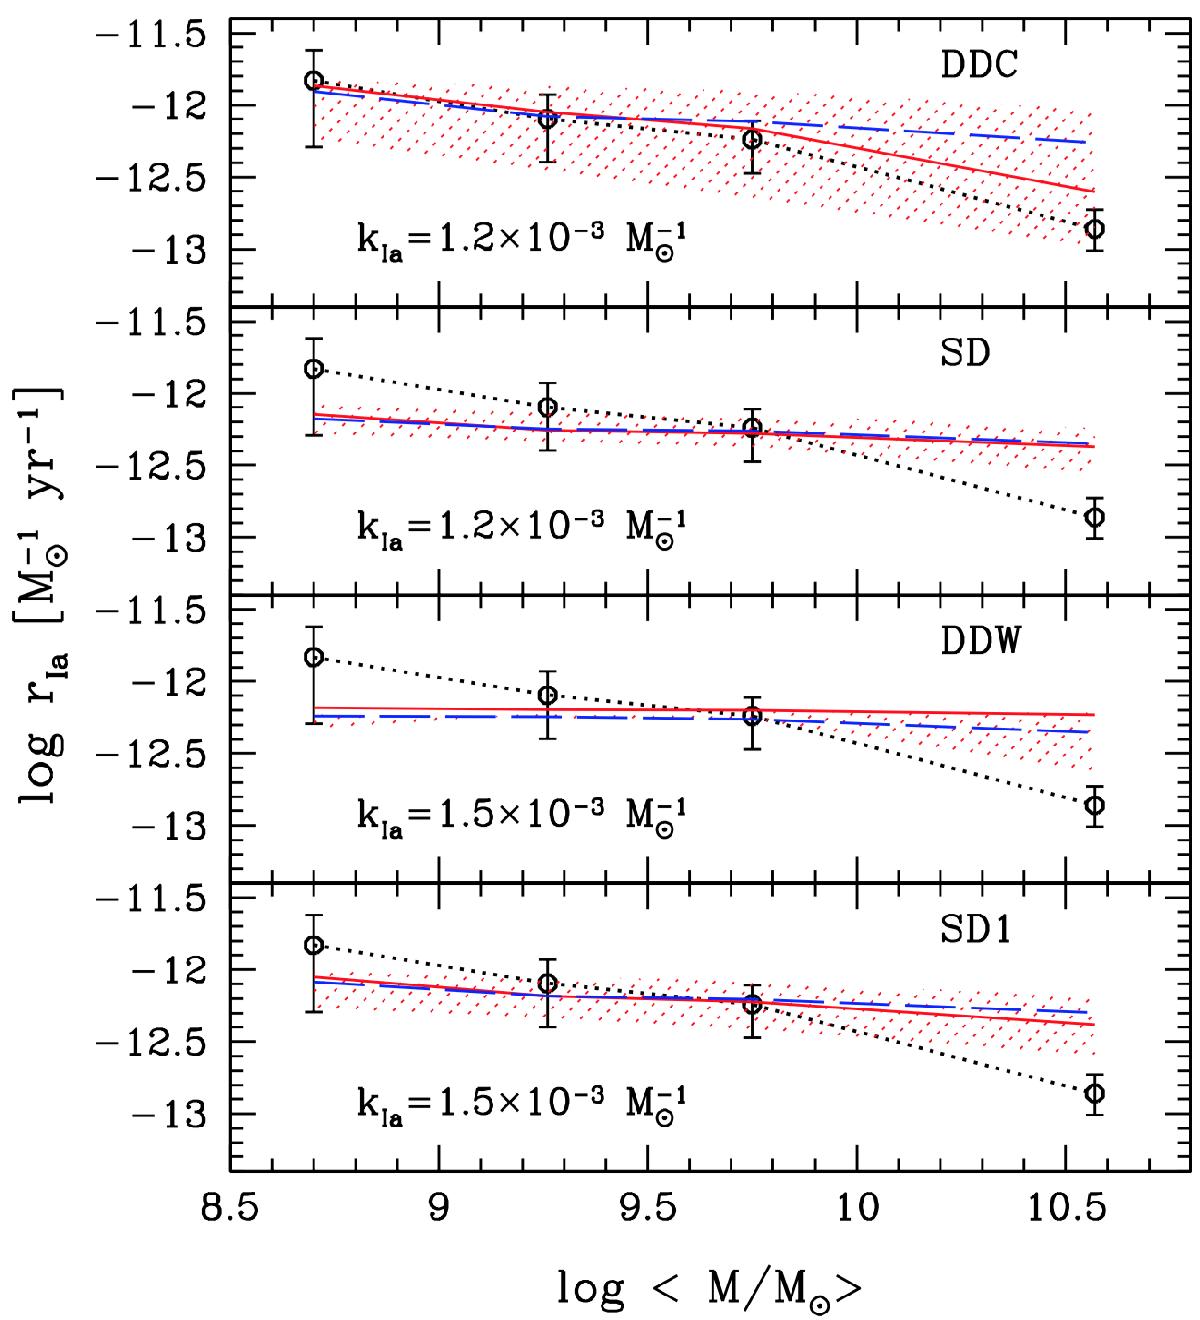
SN Ia rate as a function of galaxy mass. Black circles are the observed rates in the four mass bins, reported in Table 2, while lines connect the theoretical rates at the median ⟨ Age ⟩ of the distributions in the four mass bins. Solid (red) and dashed (blue) lines refer to exponentially declining SFH models with τ = 0.1 and 8 Gyr, respectively. The shaded areas show the range covered when using the 30th or 70th percentiles of the ⟨ Age ⟩ distribution instead of the median ⟨ Age ⟩, for the exponentially declining SFH models with τ = 0.1 Gyr.
Current usage metrics show cumulative count of Article Views (full-text article views including HTML views, PDF and ePub downloads, according to the available data) and Abstracts Views on Vision4Press platform.
Data correspond to usage on the plateform after 2015. The current usage metrics is available 48-96 hours after online publication and is updated daily on week days.
Initial download of the metrics may take a while.